US Dollar Index Price Analysis: DXY retreats from 104.00, rising wedge eyed
- DXY snaps two-day uptrend around 20-year high, stays inside bearish chart pattern.
- Failures to refresh multi-day peak, sluggish RSI keep sellers hopeful.
- 100-SMA adds to the downside filters, further advances are likely beyond 104.30.
US Dollar Index (DXY) struggles to extend the previous two-day upside momentum, on the back foot at around 103.95 during Thursday’s Asian session.
In doing so, the greenback gauge stays around the two-decade high marked earlier in the week but prints the daily loss for the first time in three days.
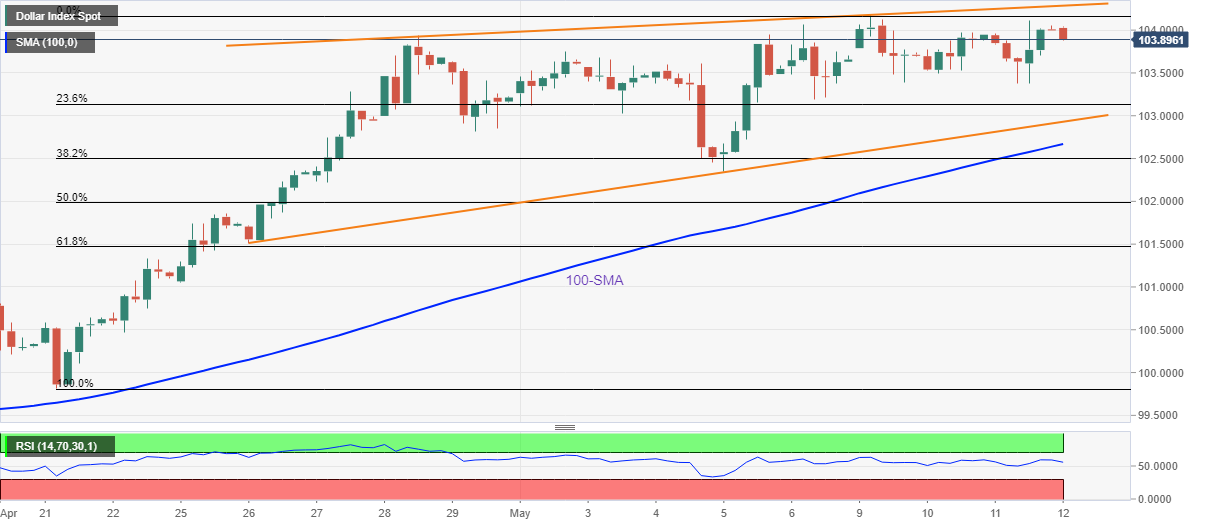
The DXY’s latest grind also highlights a 12-day-old rising wedge bearish formation around the multi-day top. Also highlighting the importance of the chart pattern is the sluggish RSI.
However, a clear downside break of 102.90 becomes necessary to confirm the theoretical fall towards 101.30.
During the fall, the 100-SMA and monthly low, respectively near 102.65 and 102.35 will act as intermediate halts.
Meanwhile, recovery remains elusive until the quote stays below the stated wedge’s resistance line, around 104.30 by the press time.
Following that, a gradual run-up towards September 2002 peak near 109.80 can’t be ruled out.
DXY: Four-hour chart
Trend: Pullback expected