AUD/USD Price Analysis: 100-DMA tests buyers ahead of China Retail Sales, Industrial Production
- AUD/USD consolidates recent losses around two-week low, sidelined of late.
- Clear break of 100-DMA, downbeat MACD signals direct bears to six-week-old support line.
- Key Fibonacci retracement levels, 200-DMA add to the upside filters.
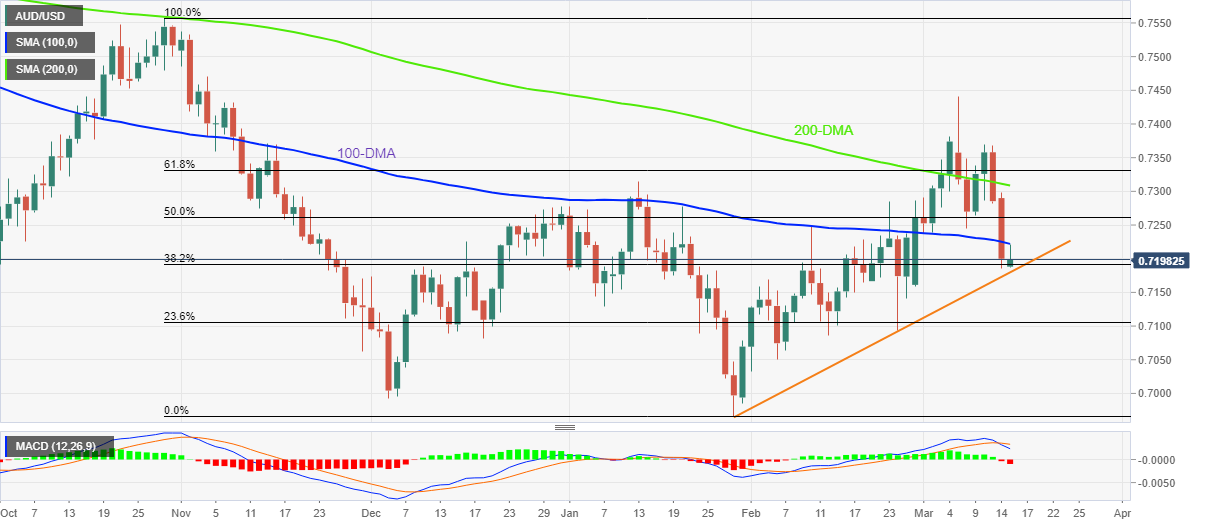
AUD/USD remains mildly bid around 0.7200 during Tuesday’s initial Asian session, following a two-day downtrend to a fortnight low.
Even so, the first daily closing below the 100-DMA in over two weeks and the most bearish MACD signals since early February keeps AUD/USD sellers hopeful.
That said, an upward sloping support line from late January, around 0.7180 at the latest, will challenge short-term sellers.
In a case where the AUD/USD prices drop below 0.7180, the early January’s low near 0.7130 and the 0.7100 threshold will be in the spotlight.
Alternatively, a clear upside break of the 100-DMA, at 0.7222 by the press time, will extend the corrective pullback towards the 50% Fibonacci retracement (Fibo.) of October 2021 to January 2022 downside, around 0.7265.
Following that, the 200-DMA and the 61.8% Fibo., respectively around 0.7310 and 0.7335, will entertain AUD/USD bulls before directing them to the monthly high of 0.7441.
AUD/USD: Daily chart
Trend: Further weakness expected