Gold Price Forecast: XAU/USD remains vulnerable while below $1761 – Confluence Detector
- Gold price attempts a bounce from six-week lows, not out of the woods yet.
- USD holds firmer amid the Evergrande crisis, Fed’s tapering calls.
- Gold bears in driver's seat as focus shifts to FOMC.
Gold price is making a minor recovery attempt from six-week lows of $1742 amid a retreat in the US Treasury yields, as the risk-off mood remains at full steam. The benchmark US 10-year yields are down about 2% so far. Escalating tensions surrounding indebted China’s property developer Evergrande and risks of a global economic slowdown weighs on the investors’ appetite for riskier assets. However, the further upside in gold price appears elusive, thanks to a broad-based US dollar strength, as the Fed’s tapering expectations and risk-aversion underpins the greenback’s safe-haven appeal.
Looking forward, gold price will remain exposed to downside risks, as investors prefer to hold the US currency ahead of this week’s Fed policy decision.
Read: Why XAU/USD appears vulnerable heading into the Fed showdown?
Gold Price: Key levels to watch
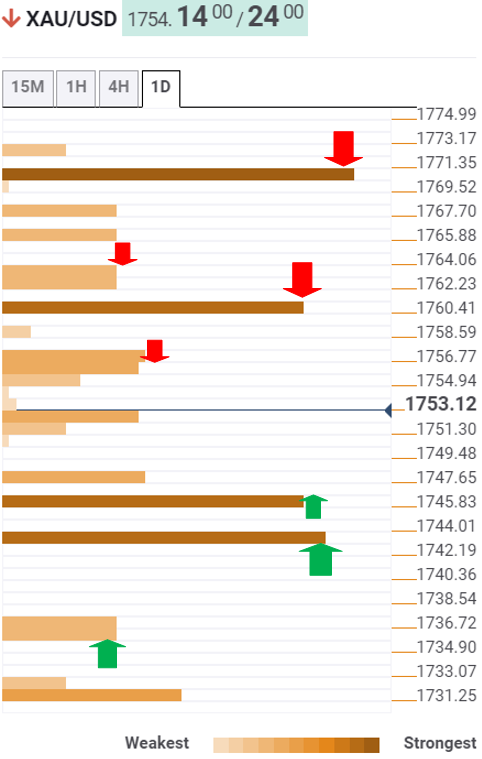
The Technical Confluences Detector shows that gold price is challenged by stiff resistance around $1755 on its road to recovery. That level is the convergence of the Fibonacci 61.8% one-day and Bollinger Band one-hour Upper.
If the recovery gains momentum, then gold bulls could threaten the upside barrier at $1761, where the Fibonacci 38.2% one-day and Fibonacci 23.6% one-week coincide.
The Fibonacci 23.6% one-day at $1764 could test the bearish commitments.
The recovery is likely to remain limited so long as gold price holds below the critical $1770 resistance, which is the Fibonacci 38.2% one-week.
Alternatively, the immediate downside appears cushioned by the previous day’s low of $1747, below which $1742 could come to the rescue of gold bulls.
At that point, the previous low four-hour and Fibonacci 38.2% one-month intersect.
A sustained move below the latter could expose the $1735 support area, which is the confluence of the Fibonacci 161.8% one-day and pivot point one-day S2.
Here is how it looks on the tool
About Technical Confluences Detector
The TCD (Technical Confluences Detector) is a tool to locate and point out those price levels where there is a congestion of indicators, moving averages, Fibonacci levels, Pivot Points, etc. If you are a short-term trader, you will find entry points for counter-trend strategies and hunt a few points at a time. If you are a medium-to-long-term trader, this tool will allow you to know in advance the price levels where a medium-to-long-term trend may stop and rest, where to unwind positions, or where to increase your position size.