AUD/JPY Price Analysis: Something for both bulls and bears
- AUD/JPY bears looking for a break of 4-hour support.
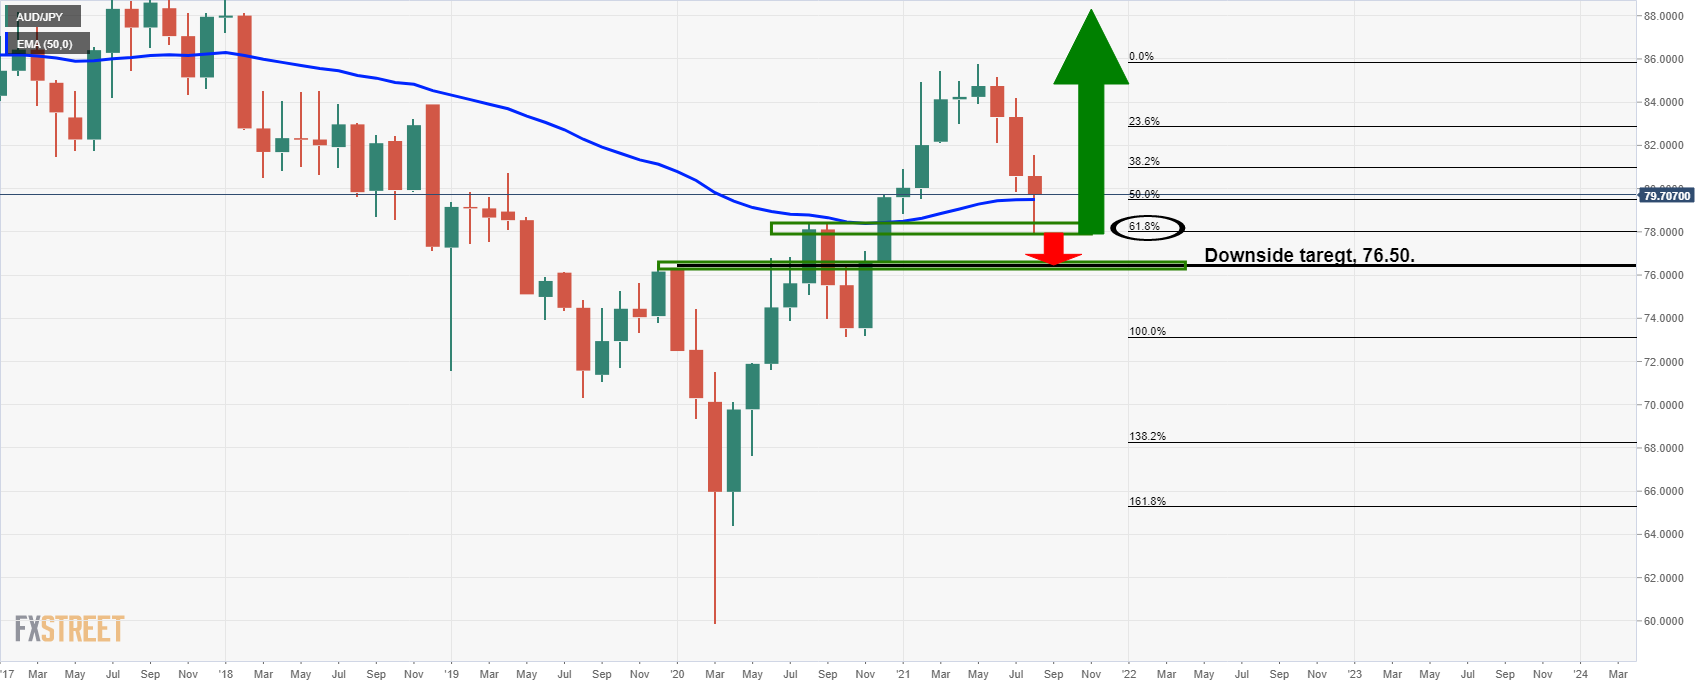
- Bulls looking to the monthly 61.8% Fibo and 50-M EMA as support.
As per the prior analysis, AUD/JPY is a focus for the end of week risk events, the risk barometer remains a key pair for Friday from a fundamental basis and also technically.
There are prospects of a downside continuation as an opportunity for traders in the coming sessions, but not until support structure is eradicated.
The following is an analysis from a daily and 4-hour perspective that arrives at a bearish bias while below the 61.8% Fibonacci, horizontal resistance as well as the critical trendline resistance as follows:
Prior analysis, daily chart
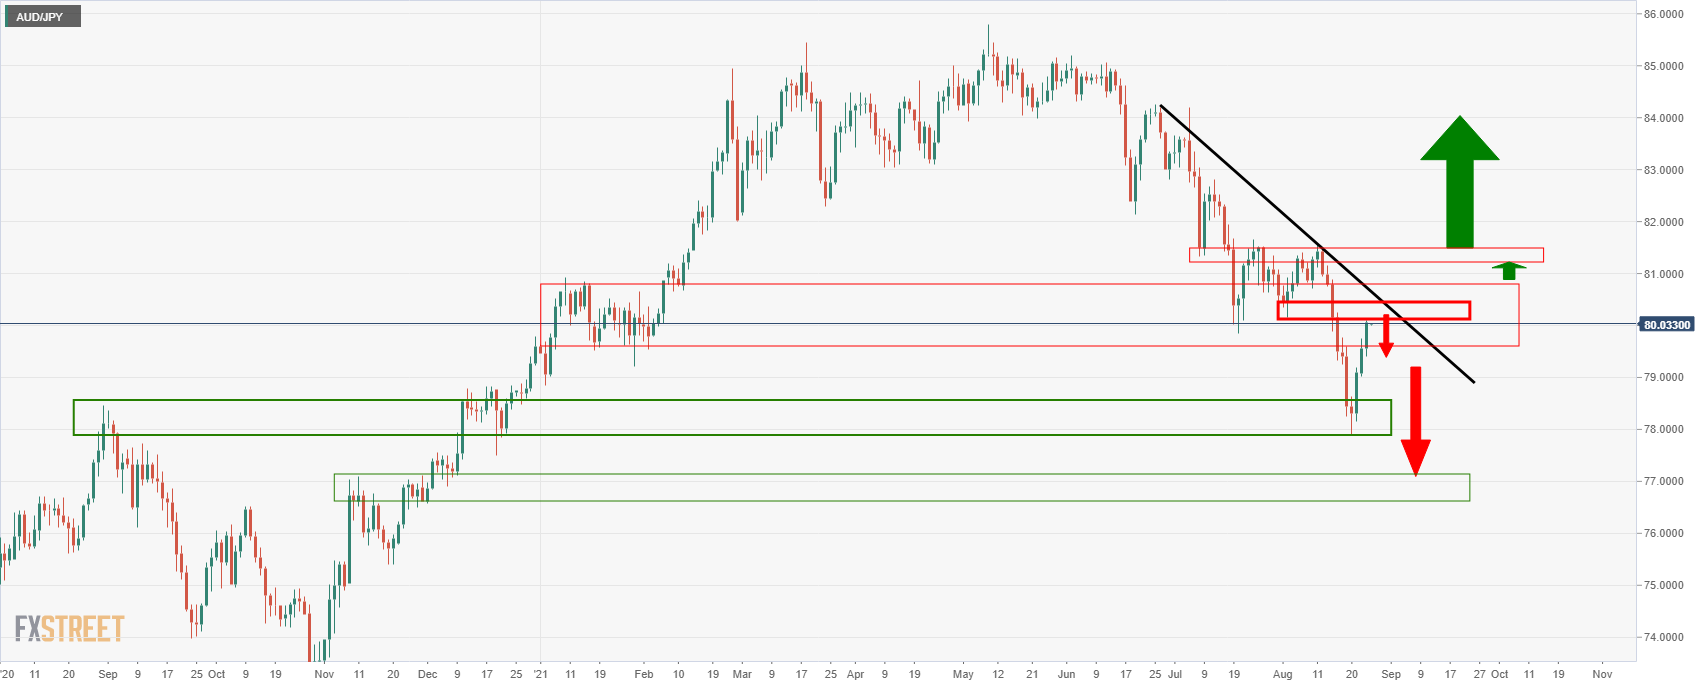
''The path of least resistance, from a structural sense, is to the downside with the broader bear trend.
If the US dollar performs on the bid, then the Aussie will likely suffer along with commodities which should see AUD/JPY move lower. ''
Live market update, daily and 4-hour chart
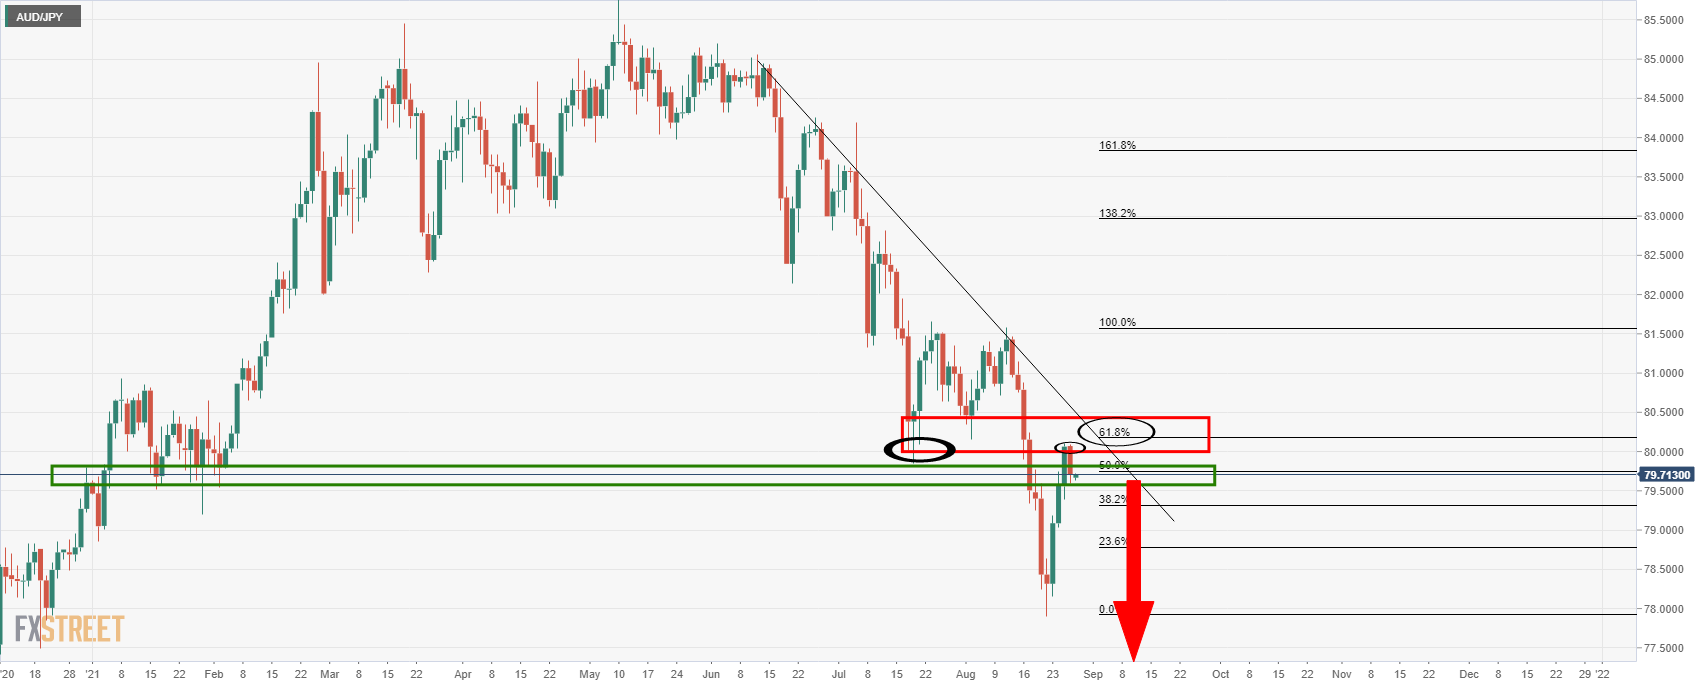
The daily chart above illustrates the small progress made by the bears from close to the 61.8% Fibonacci and confluence of prior lows, and while below the trendline resistance.
However, bears would be prudent to ensure that the 4-hour support structures are cleared prior to entering:
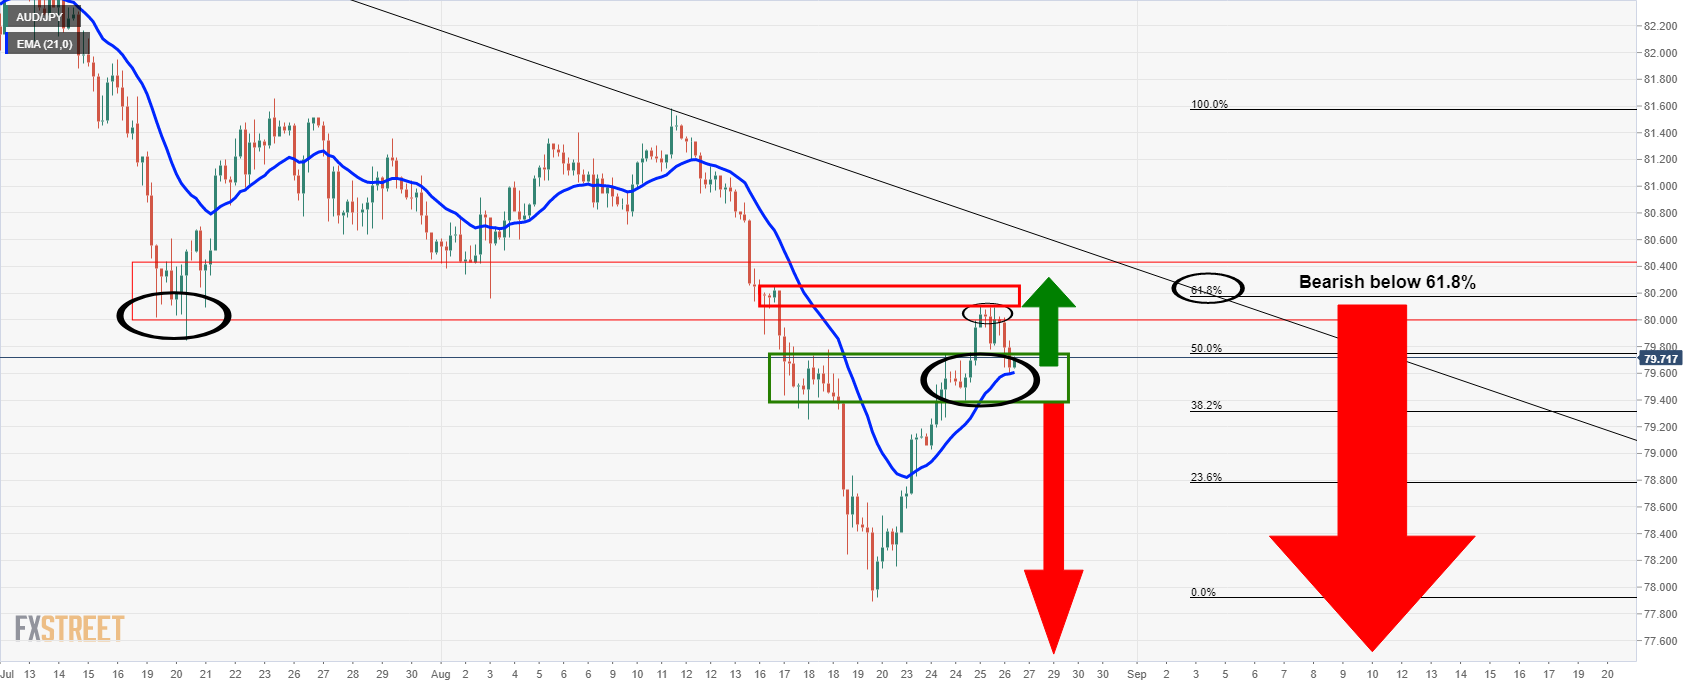
As illustrated, the 21-EMA on the 4-hour time frame aligns with a bunch of market structures.
Ideally, 79.395, the Aug 25 low, will be taken out to allow for free-fall towards daily downside targets near 76.50.
In doing so, this will also take out a critical 50-month EMA at 79.55.
However, on that note, traders should take note of the longer-term structures which could prove to be problematic between 78.46 and 77.90.
The market already was rejected at the 61.8% monthly Fib retracement and there are prospects of a longer-term upside continuation following the monthly correction: