AUD/USD Price Analysis: Rebounds but bearish bias remains intact
- AUD/USD rebounds to test the 21-SMA resistance on the 4H chart.
- The aussie remains poised to test the triangle support at 0.7436.
- RSI edges higher but remains below the midline.
AUD/USD is looking to extend its recovery following a dip to the 0.7450 support area, as the bears take a breather before resuming the next downswing.
The aussie remains weighed down by the mixed Australian employment data and slowing Chinese growth concerns. However, the resumption in the US dollar’s decline, in the wake of dovish Fed Chair Jerome Powell’s testimony, saves the day for the aussie bulls.
Looking at AUD/USD’s four-hour chart, the price is trending within a symmetrical triangle formation, facing a bunch of healthy resistance levels on its recovery attempt.
Immediate resistance is seen at the horizontal 21-Simple Moving Average (SMA) at 0.7470, above which the confluence of the triangle resistance and bearish 50-SMA near 0.7483 will come into play.
A sustained break above the latter will confirm a triangle breakout, opening doors for a test of the 0.7500 round number and beyond.
AUD/USD four-hour chart
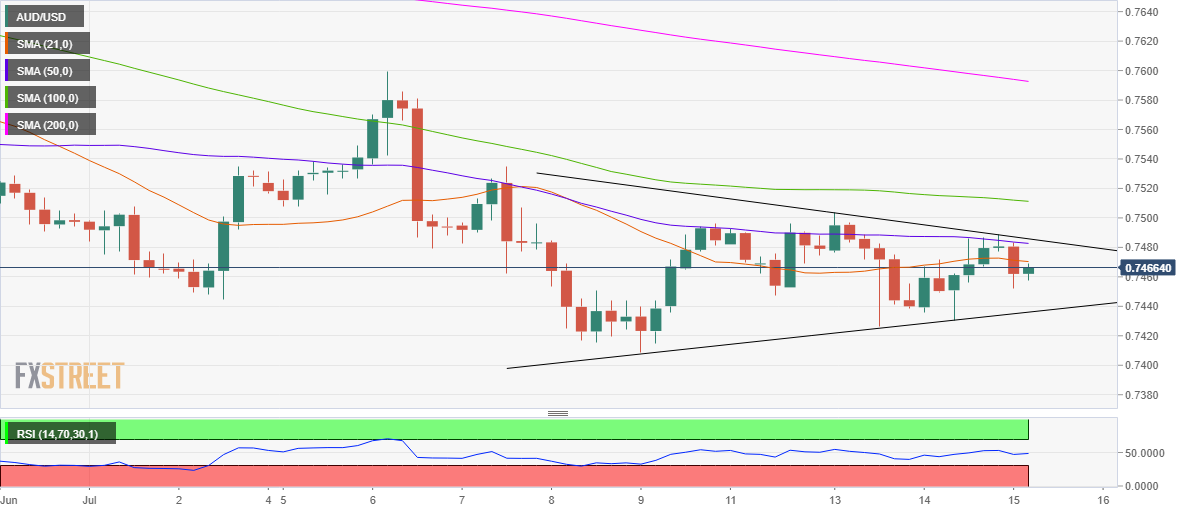
However, with the Relative Strength Index (RSI) inching higher while still below the midline, keeps the selling interest alive.
Therefore, a failure to find acceptance above the 21-DMA barrier could revive the bearish momentum towards the triangle support at 0.7436. The next bearish target appears at 0.7400.
AUD/USD additional levels to watch