Silver Price Analysis: XAG/USD defends key support above $27
- Silver bulls trying hard to fight back control on Wednesday.
- A bounce towards $28 cannot be ruled amid bullish RSI.
- Bull cross on the 4H chart favors the XAG bulls.
Having faced rejection just shy of the $28 mark, Silver (XAG/USD) tumbled on Tuesday, now consolidating the downside above the $27 level.
The bull-bear tug-of-war seems to extend in the European session, as the price continues range within a rising wedge formation since February 2 on the four-hour chart.
Silver Price Chart: Four-hour
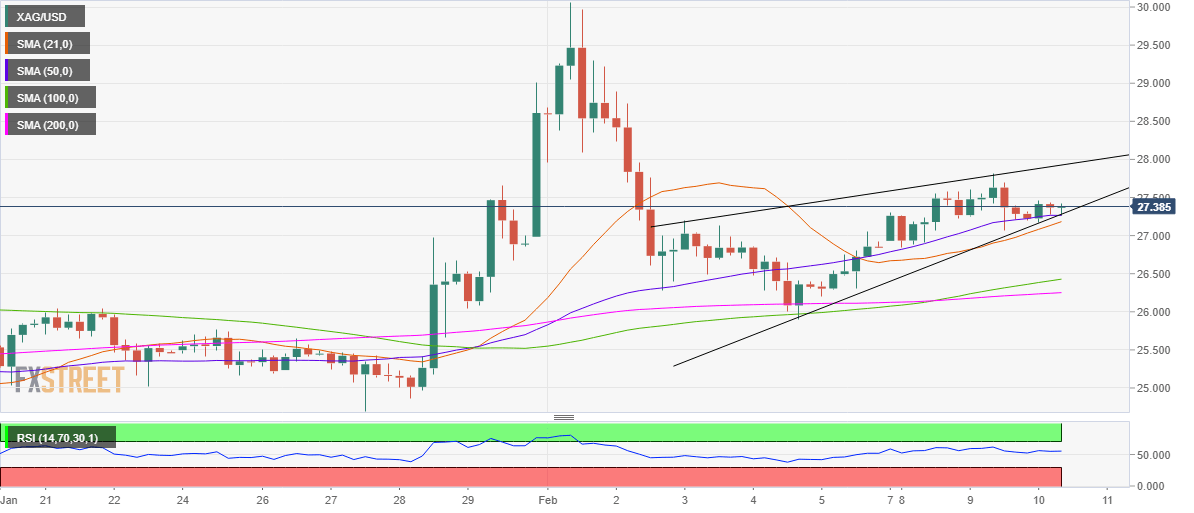
With Tuesday’s fall, the metal confronts the critical cap around $27.25, which is the confluence of the rising trendline support, 50-simple moving average (SMA) and 21-SMA.
A breach of the latter could validate a rising wedge breakdown, opening floors for a test of the measured target at $25.30.
Ahead of that, the 100-SMA cushion at $26.42 as well as 200-SMA at $26.25 would come into play.
However, the Relative Strength Index (RSI) holds above the midline, although trading flattish around 55.00, keeps the buyers hopeful.
Therefore, so long as the spot manages to hold onto the 50-SMA support, a bounce towards Tuesday’s high of $27.81 cannot be ruled.
Silver Additional levels