30 Nov 2020
US Dollar Index Price Analysis: Extra losses in the pipeline
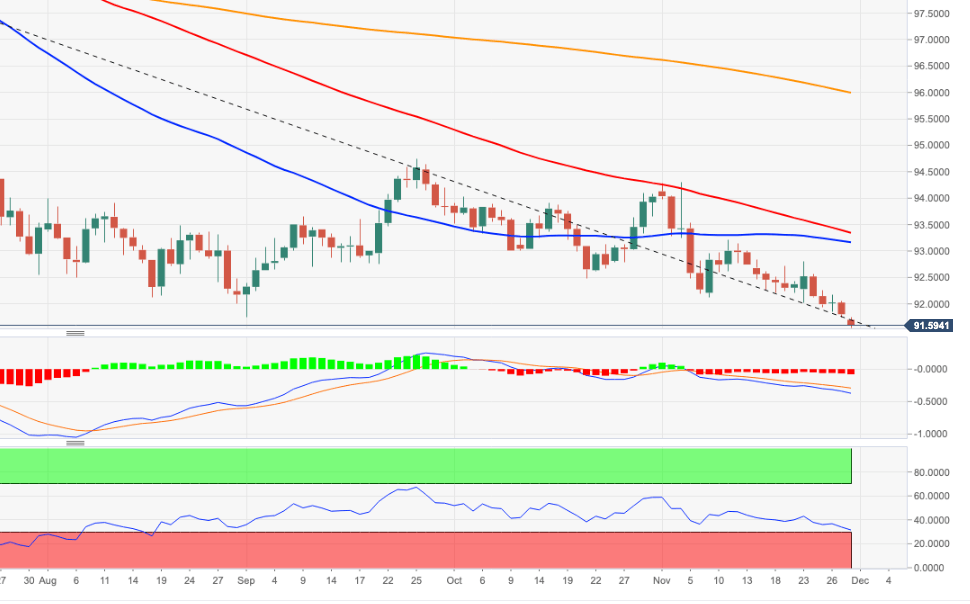
- DXY breaks below the 8-month support line.
- The dollar clinches new 2020 lows around 91.55.
The downside momentum in DXY has accelerated as of late following the breakdown of a Fibo level in the 91.90 region and the 8-month support line near 91.80.
Therefore, the continuation of the downtrend is a palpable possibility with the next level of relevance at the April 2018 lows near 89.20.
Occasional bullish attempts need to surpass the 93.20 level (November 11) to mitigate the downside pressure somewhat. However, as long as DXY trades below the 200-day SMA, today at 95.98, the offered stance is forecast to persist.
DXY daily chart