USD/JPY Price Analysis: Looks north, teasing triangle breakout on 1H chart
- USD/JPY bulls look to extend the upside towards 106.00
- Symmetrical triangle breakout likely on the hourly chart.
- The spot has regained 21-HMA amid bullish RSI.
USD/JPY is tracking the bounce in the US dollar across the board as the vaccine optimism appears overshadowed by the surging coronavirus cases in the US.
The resurgent haven demand for the US dollar as a safe-haven is likely to bode well for the spot while holiday-thinned market conditions could also lend support to the pair’s rebound.
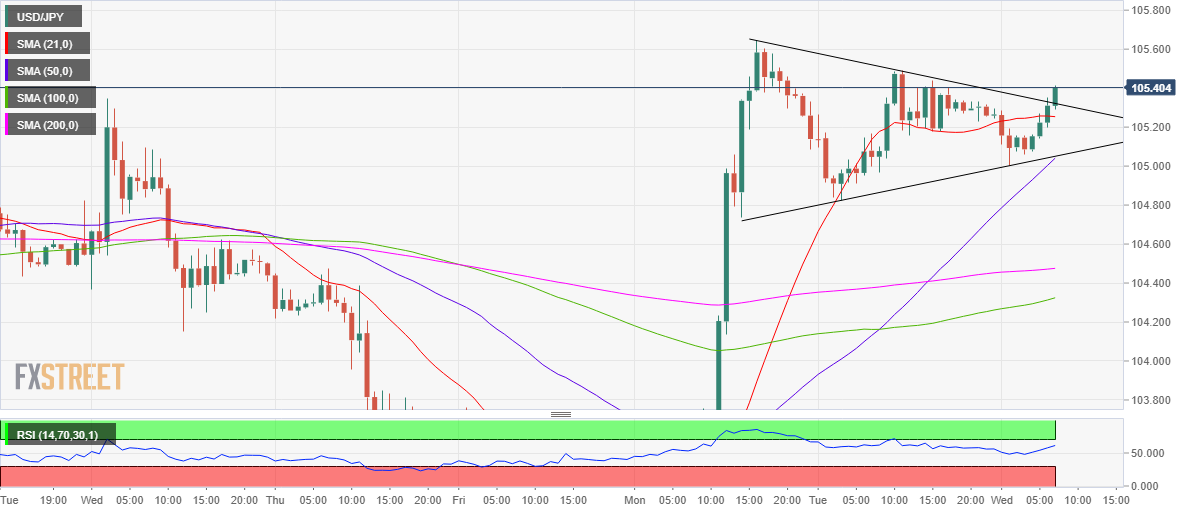
The technical outlook for USD/JPY has turned bullish in the near-term, as the price is on the verge of a symmetrical triangle breakout on the hourly chart.
The bulls need an hourly closing above the falling trendline resistance at 105.32 to validate the bullish breakout.
The upside risks are skewed towards a test of the three-week tops of 105.64, paving the way for the 106 level.
To the downside, immediate support awaits at the 21-hourly moving average at 105.25, which earlier a key resistance.
Further south, the confluence of the bullish 50-HMA and rising trendline (pattern) support at 105.05 will test the bears’ commitment.
more to come ...
USD/JPY: Hourly chart