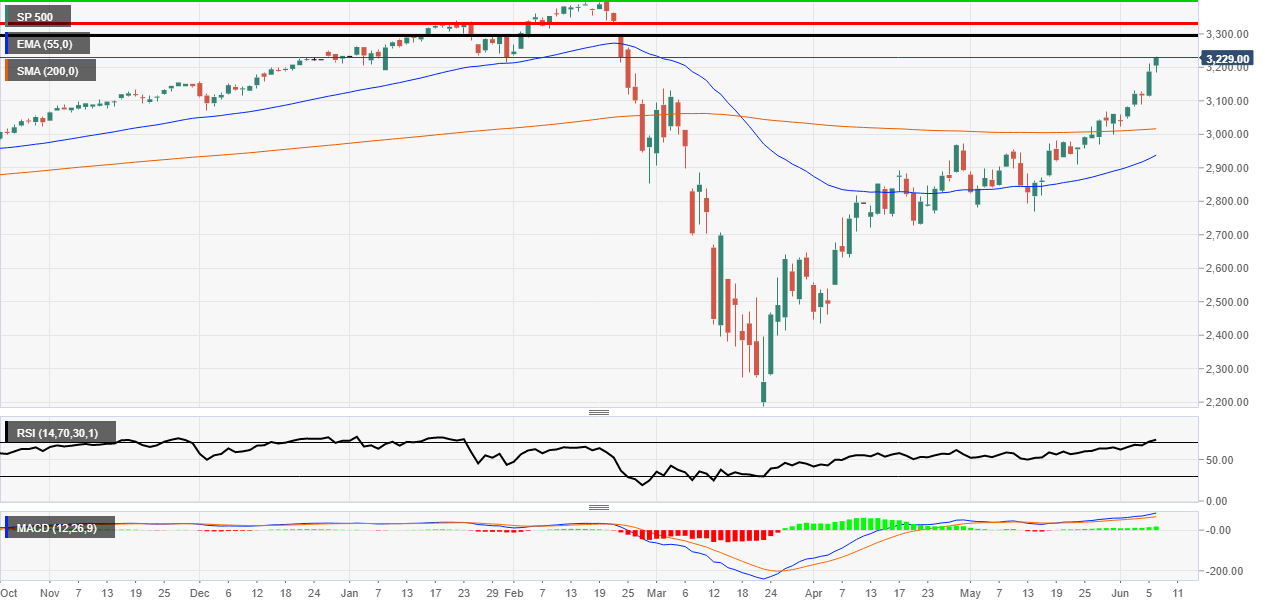
S&P 500 is under 5% away from the all time high
- The S&P 500 is just a stone's throw away from the all-time high.
- The market is also close to some gaps which could be resistance zones.
S&P 500 daily chart
The S&P 500 is still on a tear and it just under 5% away from hitting a new all-time high. It is very hard to believe considering the current economic situation but the Fed stimulus and the easing of global lockdown measures seems to be getting investors and traders excited.
Looking closer at some of the key technical levels, the price is close to the gap low created on 24th February of 3259.8. The next wave up is the area where the gap was created at 3328.5. Of course, the technical indicators are all in overbought territory. The Relative Strength Index (RSI) is at its highest level since January 17th.
The current all-time high is 3393.5 and the market looks set to hit that level. On the intraday timeframes, it seems that the market has had may divergence signals that have been ignored. Today was no different as the hourly chart threw up a few on both the MACD and RSI. As they say, the market will soldier on and it seems investors and traders are buying every day.
Additional levels