19 Nov 2019
US Dollar Index Technical Analysis: DXY ready for the next leg up?
- DXY has been consolidating on the second day of the week.
- Support is seen at the 97.70 level.
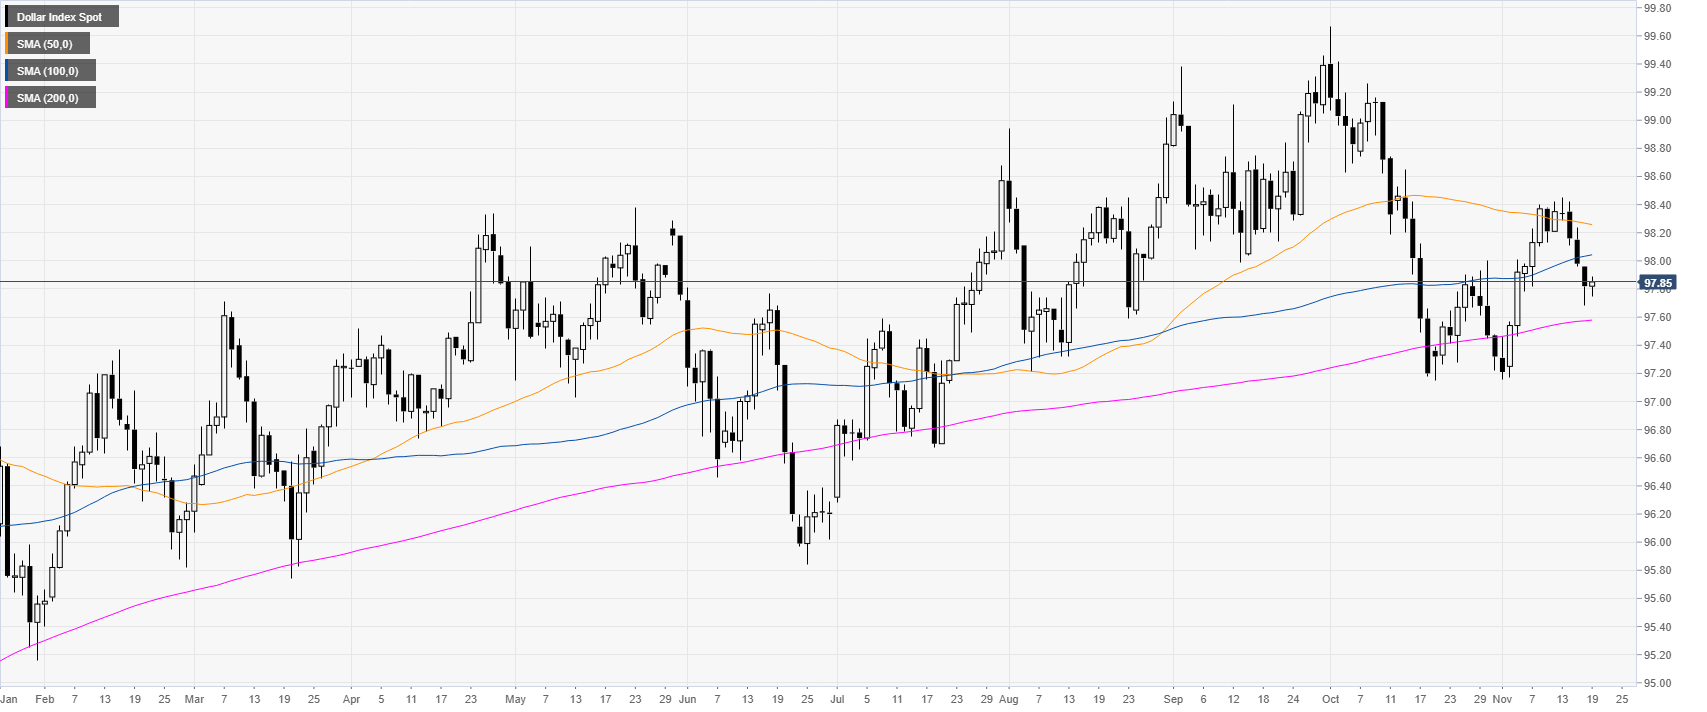
DXY daily chart
DXY (US Dollar Index) is trading in an uptrend above its 200-day simple moving average (DMA). This Tuesday, the market traded quietly within last Friday’s range.
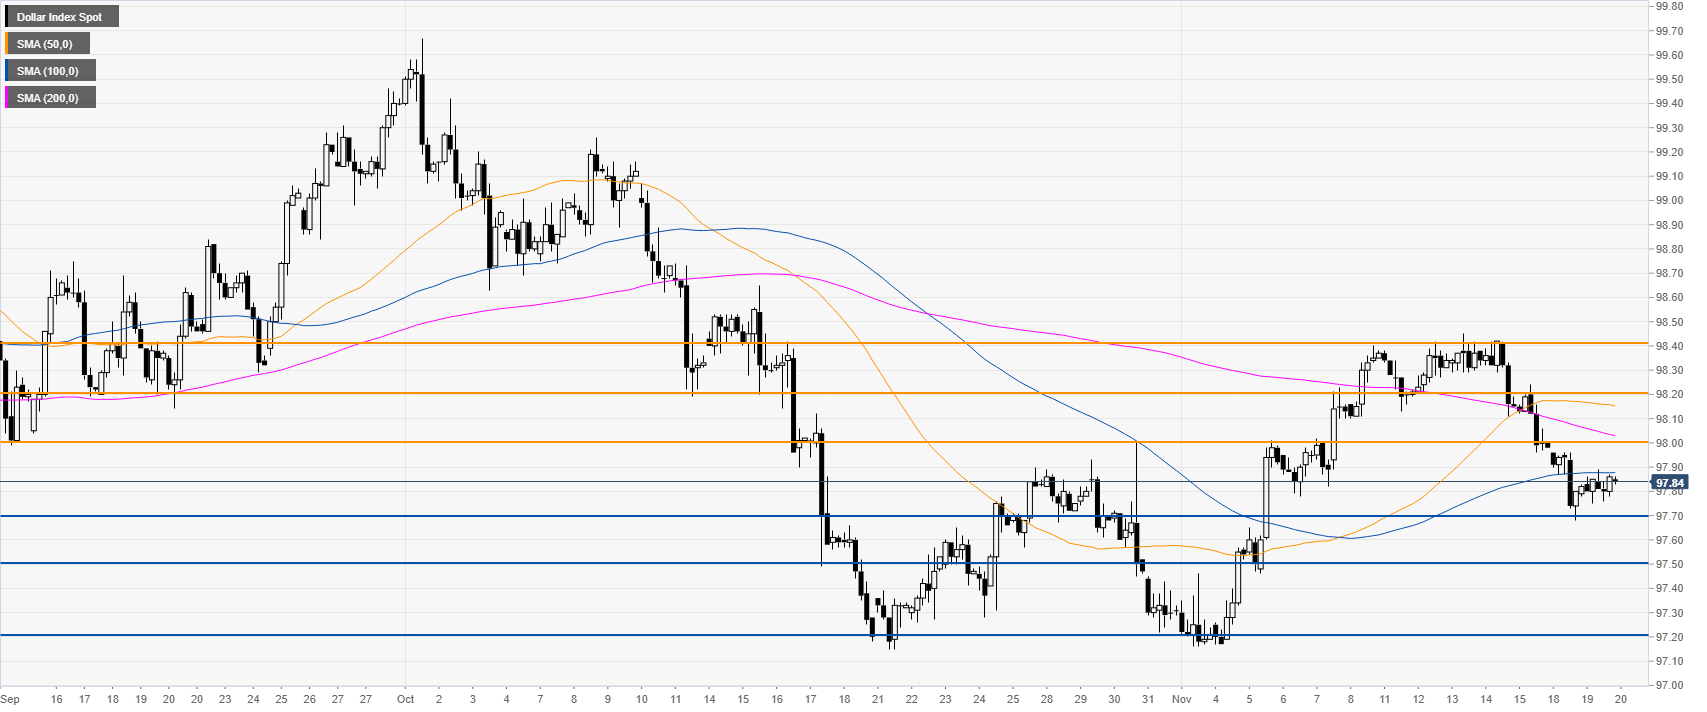
DXY 4-hour chart
DXY bounced from the 97.70 level near the 61.8% Fibonacci retracement from the November bull run. In the absence of a bear breakout below the 97.70 level, DXY is set to resume the uptrend targetting initially the 98.00 level, followed by 98.20 and 98.40, near November highs.
DXY 30-minute chart
The greenback is trading above the 50 SMA, suggesting a potential correction up in the medium term. However, if 97.70 fails to hold prices, the market might drop towards the 97.50 level.
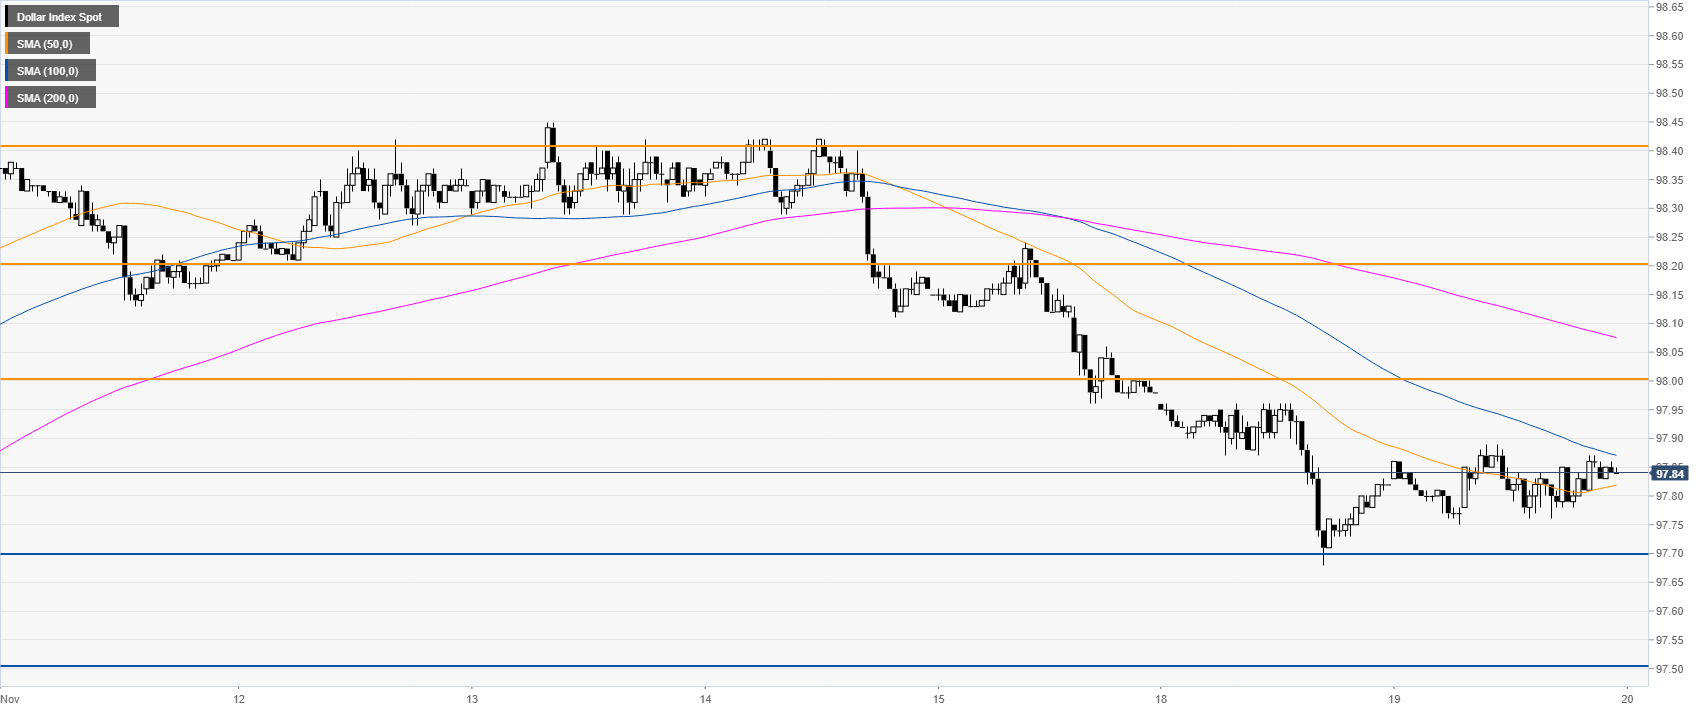
Additional key levels