EUR/GBP technical analysis: On its way to multi-month-old support trendline
- EUR/GBP stays below 200-week SMA.
- Failure to cross the key SMA, amid bearish MACD, portrays bears’ strength.
- An upward sloping trendline since April 2017 becomes important to watch.
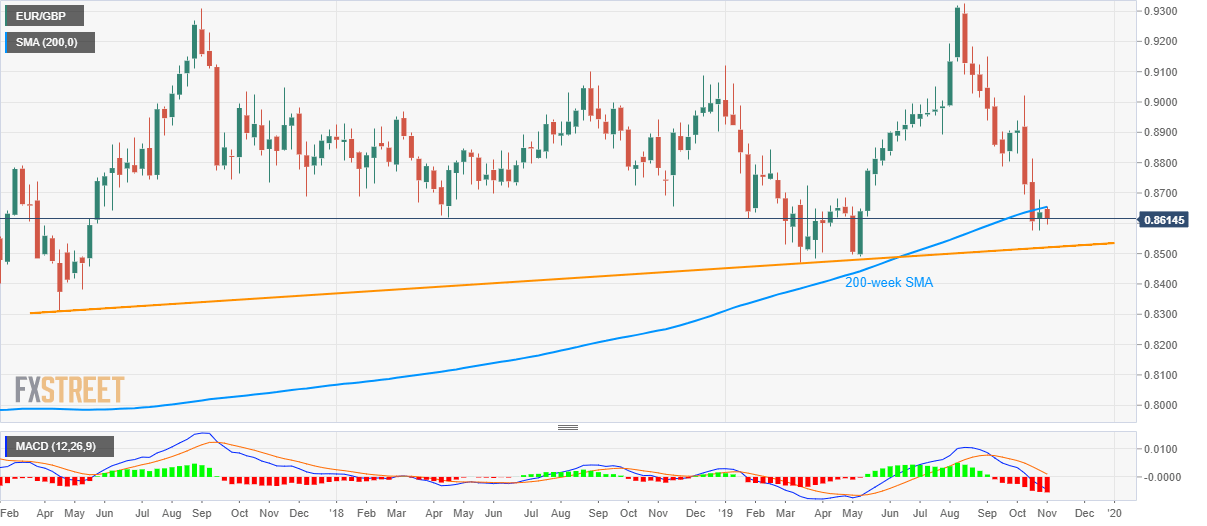
Having reversed from 200-week Simple Moving Average (SMA) multiple times off-late, the EUR/GBP pair seems all set to extend its downpour while taking rounds to 0.8612 ahead of the European open on Friday.
Also favoring sellers is the bearish signals by 12-bar Moving Average Convergence and Divergence (MACD) indicators.
As a result, the pairs’ declines to an ascending support line since April 2017, at 0.8520 now, become more likely. However, recent low surrounding 0.8575 might offer intermediate support.
In a case prices keep trading southward past-0.8520, the yearly bottom close to 0.8470 will be on the Bears’ radar.
Meanwhile, pair’s ability to rise beyond the 200-week SMA level of 0.8655 can trigger fresh run-up towards 0.8730 and then to September month low near 0.8900.
EUR/GBP weekly chart
Trend: Further weakness likely