AUD/USD technical analysis: Aussie registers biggest quarterly drop since 2016
- AUD/USD dropped 3.8% in the July-September period – the biggest quarterly drop in nearly three years.
- The immediate outlook is neutral with the pair trapped in a 40 pip range.
The AUD/USD pair fell by 3.88% in the third quarter – its biggest quarterly drop since the final three months of 2016. Back then, the AUD had dropped by 5.96%.
It is worth noting that the Aussie dollar has reported losses in seven out of the last eight quarters.
The losing run could be extended to the fourth quarter of 2019 as the US and China are unlikely to reach a permanent deal anytime soon and the Reserve Bank of Australia is widely expected to hit the zero lower bound in the next year or so.
The central bank is widely expected to cut rates today by 25 basis points to a new record low of 0.75% and ease further in February.
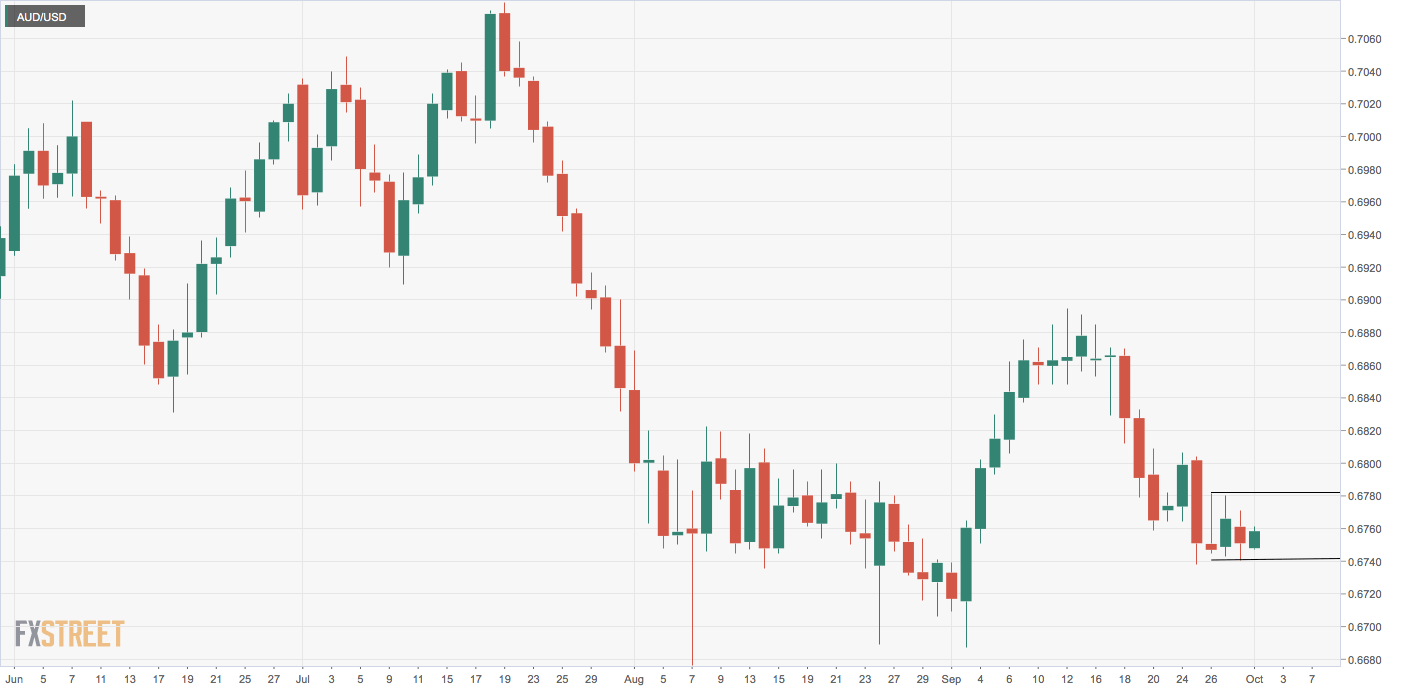
As of now, the pair is lacking a clear directional bias. The Aussie dollar has been restricted largely to a narrow range of 0.6740 to 0.6780 since Thursday.
A break above 0.6780 would expose resistance at 0.6820-0.6850. However, the MACD histogram is reporting bearish condition. Therefore, a downside break of the recent trading range looks likely. A range breakdown would allow a deeper drop to 0.6687 (Sept. 3 low).
Daily chart
Trend: Neutral-to-bearish
Technical levels