26 Aug 2019
Gold technical analysis: Yellow metal off multi-year highs, challenging 1,530.00 support
-
Gold is retreating this Monday on the back of easing trade tensions between the US and China.
-
The level to beat for sellers is $1,530.00/oz and 1,510.00 support.
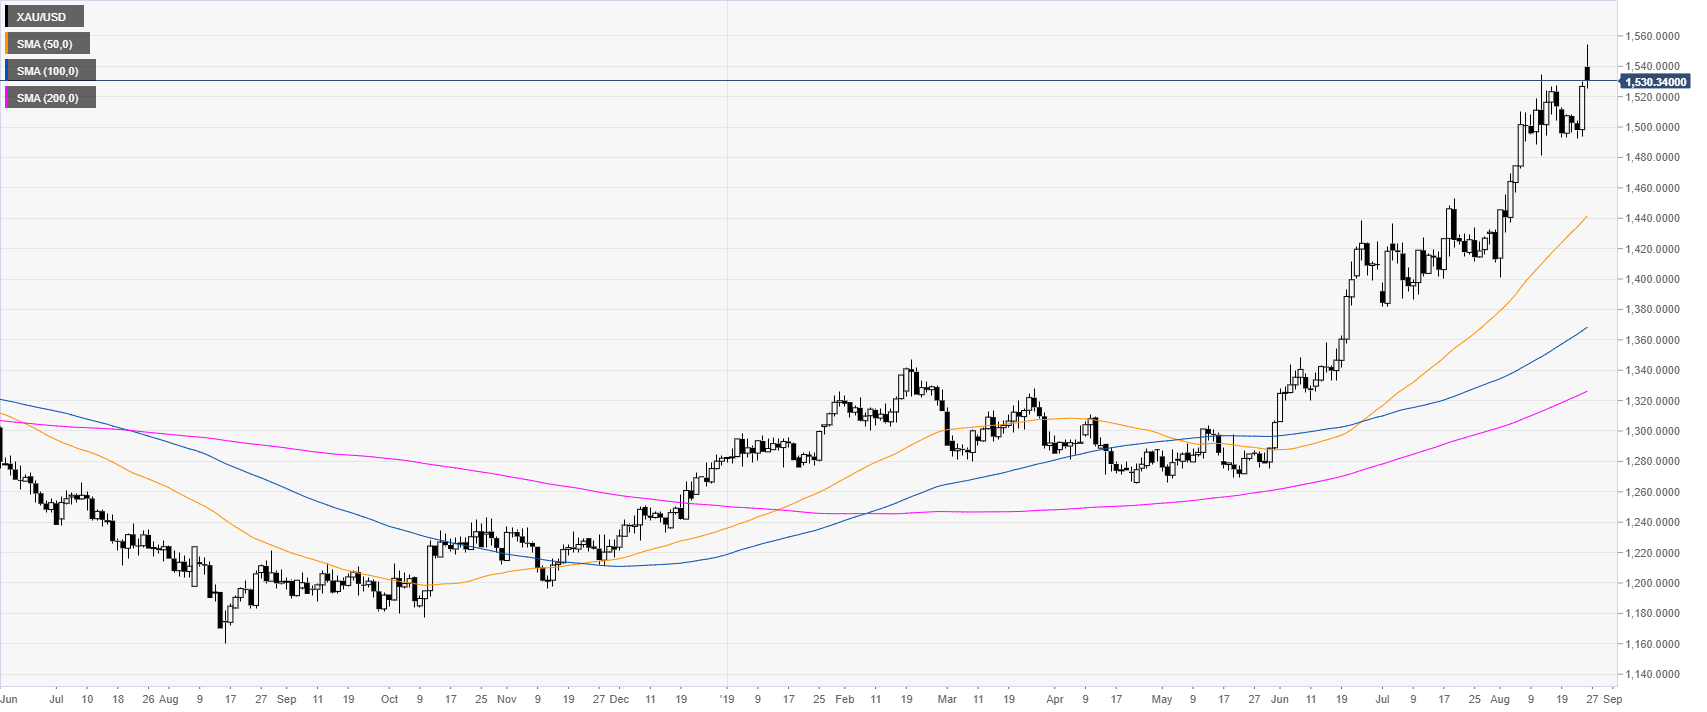
Gold daily chart
Gold is off multi-year highs after peaking at 1,554.63 earlier this Monday. Both China and the US appear willing to negotiate, therefore decreasing the demand for the safe-haven non-yielding asset.
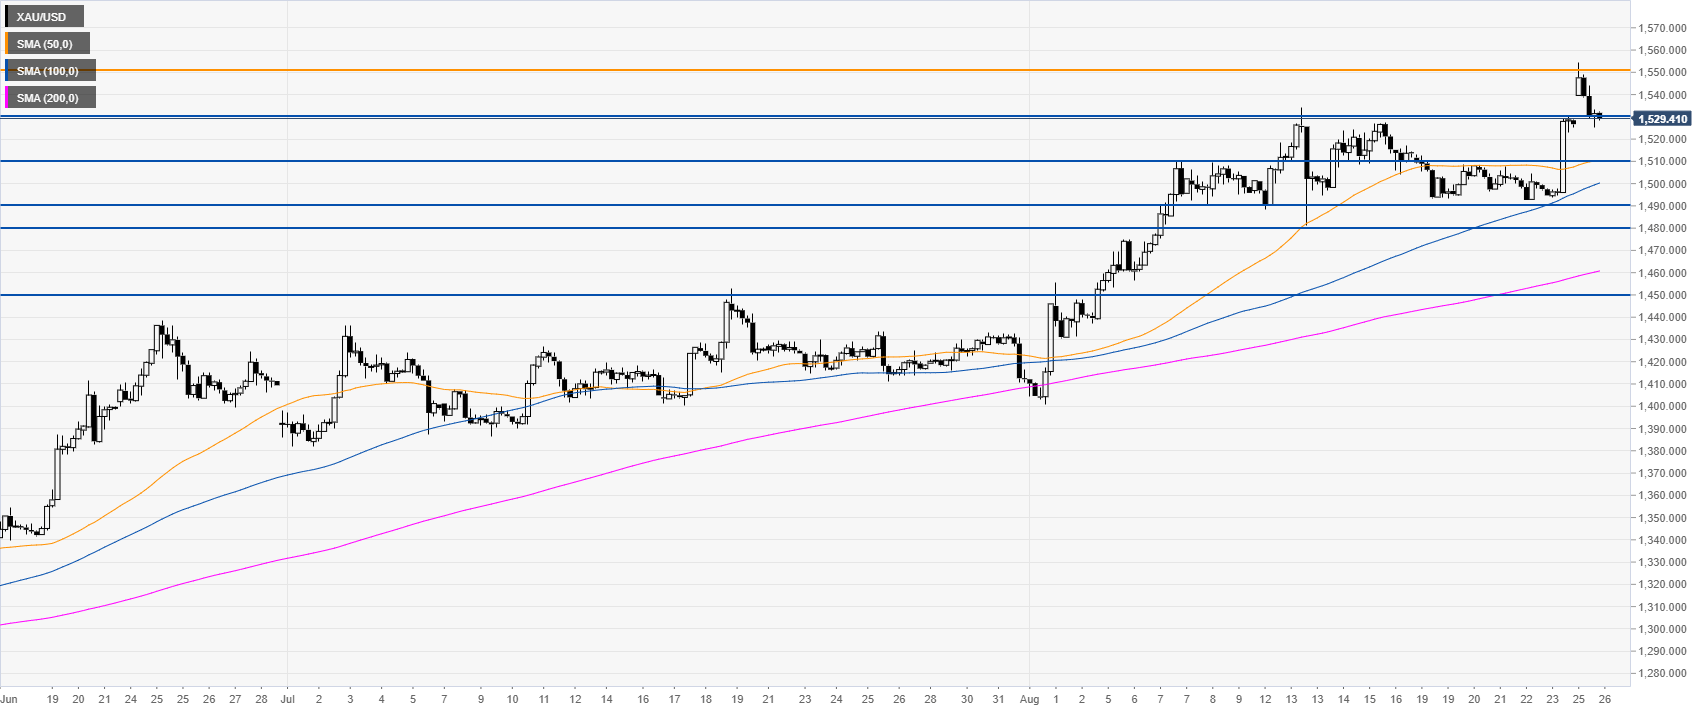
Gold 4-hour chart
The yellow metal closed the weekly gap as the market is hovering near 1,530.00. Bulls would need to defend this level to create a potential move up towards 1,550.00 resistance.
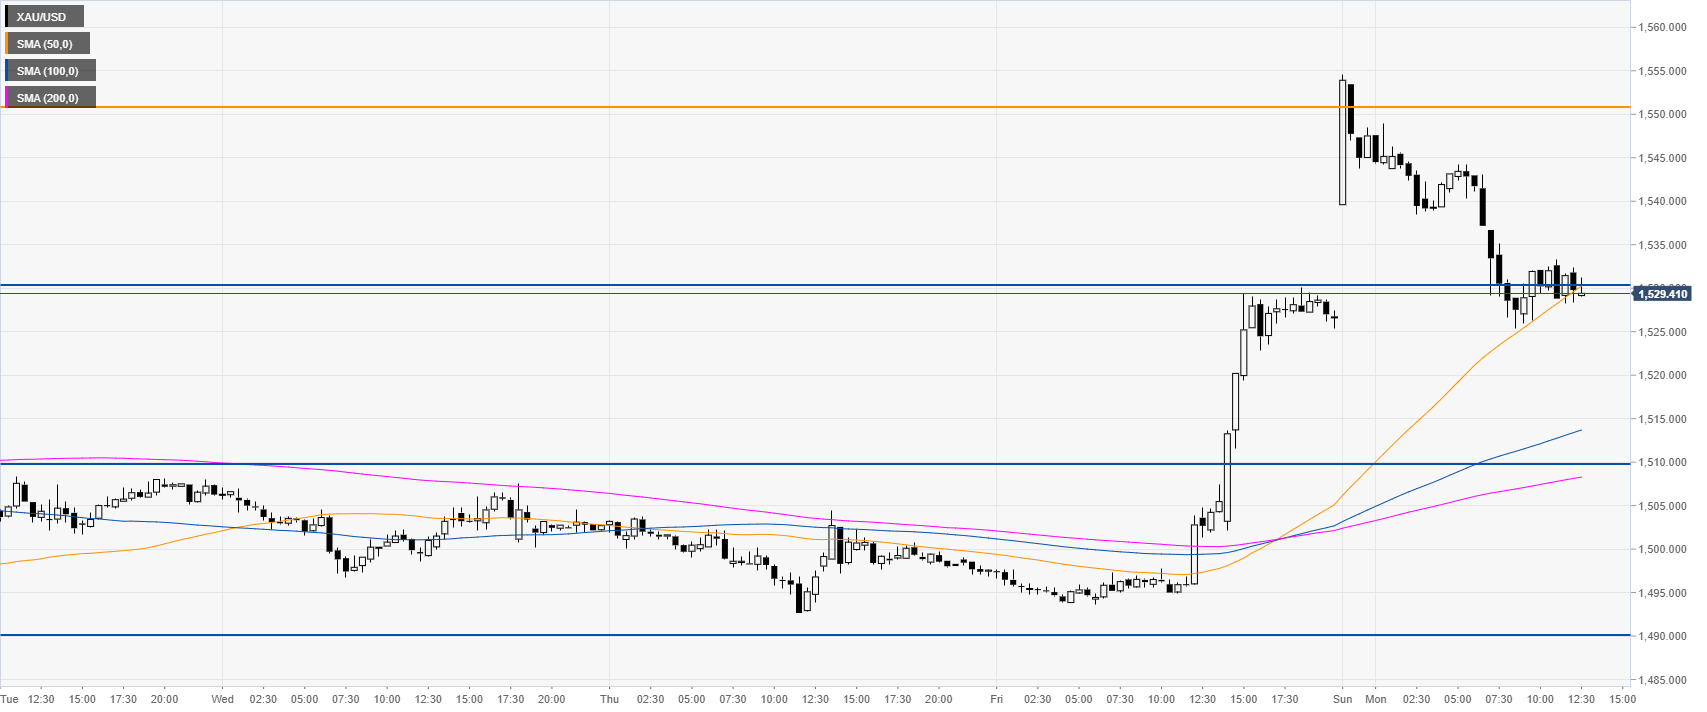
Gold 30-minute chart
Gold is challenging the 1,530.00 support and the 50 SMA. If the sellers keep the pressure on the metal, the market could reach 1,510.00 and 1,490.00 to the downside.
Additional key levels