20 Aug 2019
GBP/USD technical analysis: Cable under pressure below the 1.2100 handle
- GBP/USD is weak below 1.2100 in the New York session
- The levels to beat for bears are the 1.2065 and 1.2052 levels.
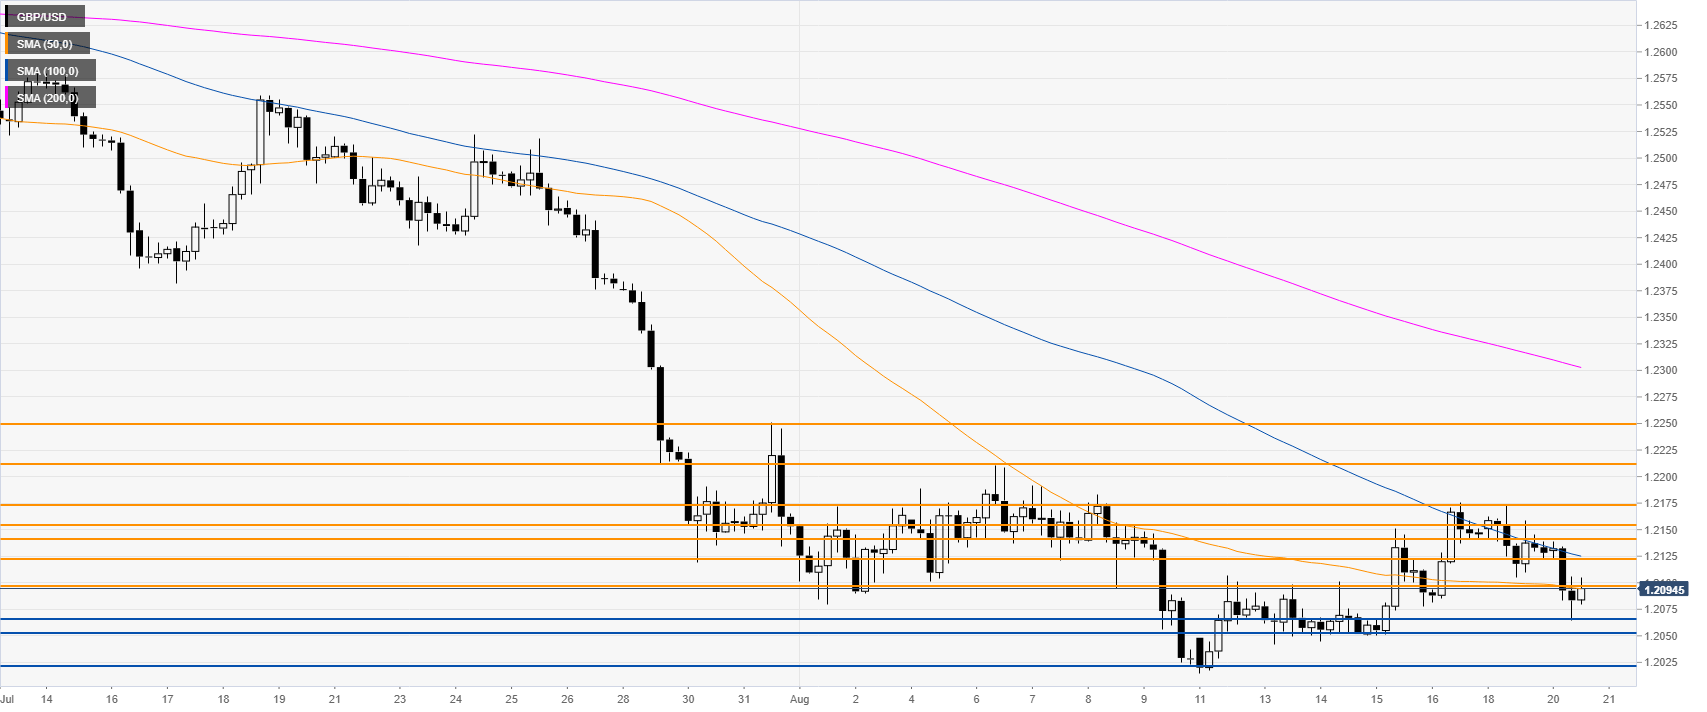
GBP/USD daily chart
The Cable is trading in a bear trend below the main daily simple moving averages (SMAs).

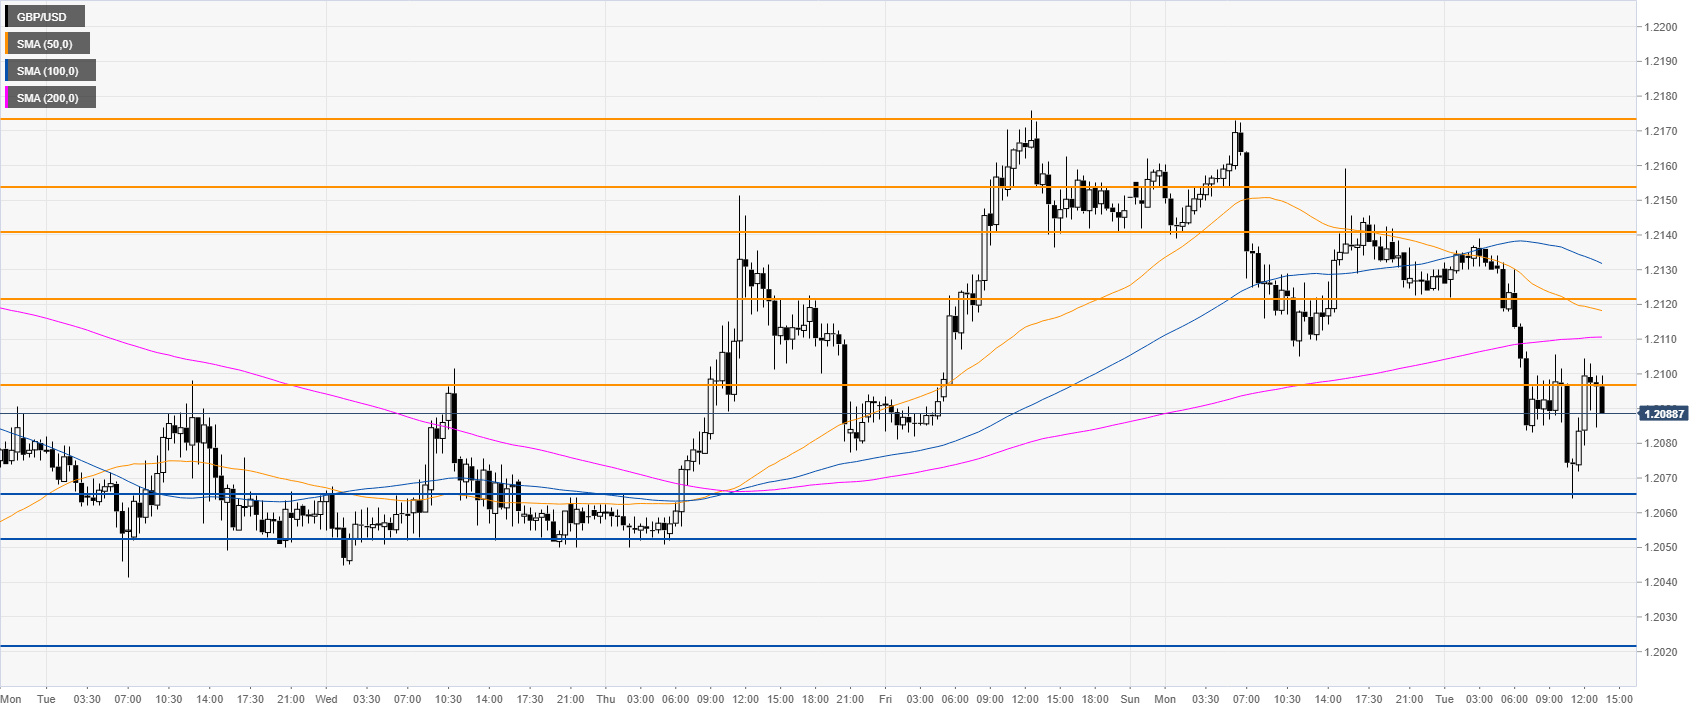
GBP/USD 4-hour chart
GBP/USD is trading below 1.2097 resistance and the 100/200 SMAs suggesting a bearish bias in the medium term. The levels to beat for bears are 1.2065, followed by 1.2052, 1.2021 according to the Technical Confluences Indicator.
GBP/USD 30-minute chart
GBP/USD is losing steam on Tuesday. Immediate resistances are seen at 1.2097, 1.2122, 1.2141, 1.2154 and the 1.2173 level, according to the Technical Confluences Indicator.
Additional key levels