17 Jun 2019
S&P500 technical analysis: And the consolidation keeps going near the 2,900.00 mark
- The S&P500 is entering its second week of consolidation after the bull run seen in early June.
- The level to beat for bulls is seen at 2,910.00 resistance.
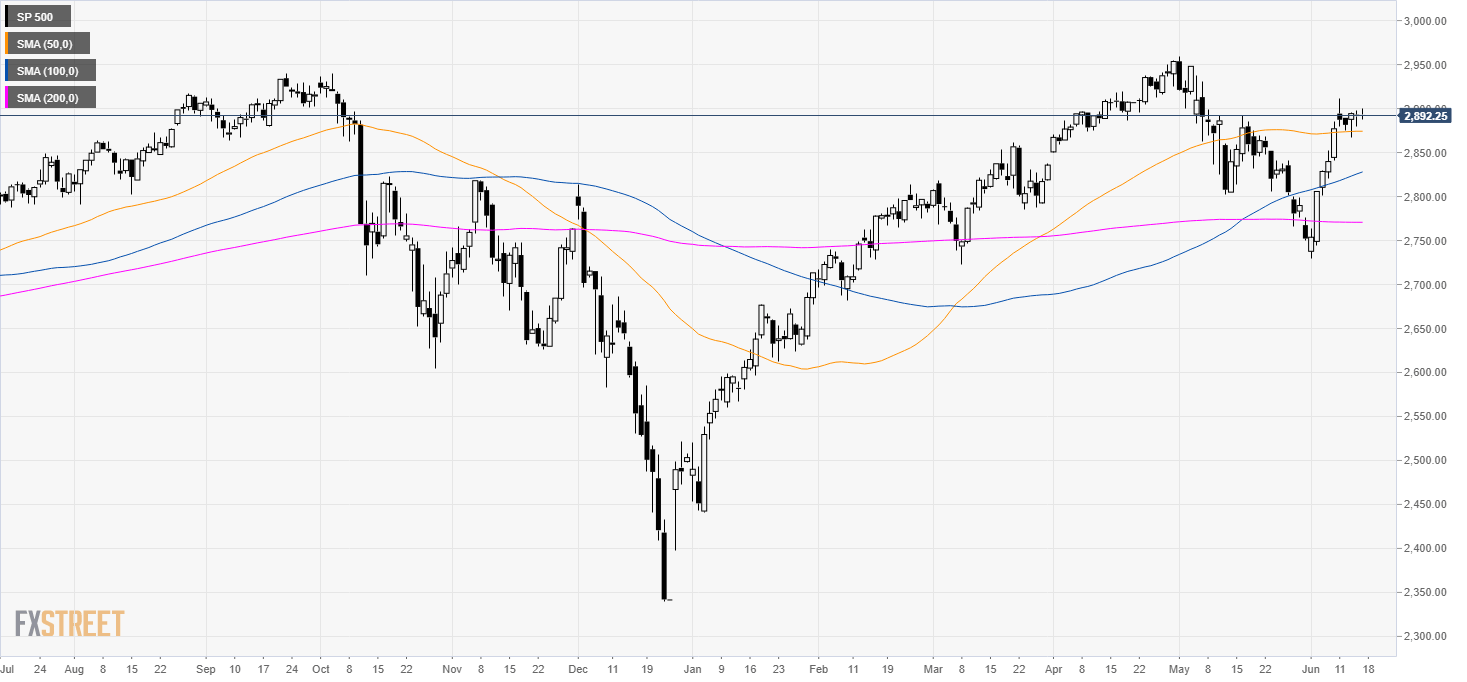
S&P500 daily chart
The S&P500 Index is consolidating the gains of the last two weeks below the 2,900.00 handle. The market is seen as bullish above its main daily simple moving averages (DSMAs).
S&P500 4-hour chart
The American stock index is trading above its main SMAs suggesting bullish momentum in the medium term. The 50 SMA crossed above the 200 SMA which is a bullish sign. Buyers are looking for a potential break above 2,910.00 to reach 2,940.00 and 2,960.00 resistances. Immediate support can be located at 2,880.00 and 2,840.00.
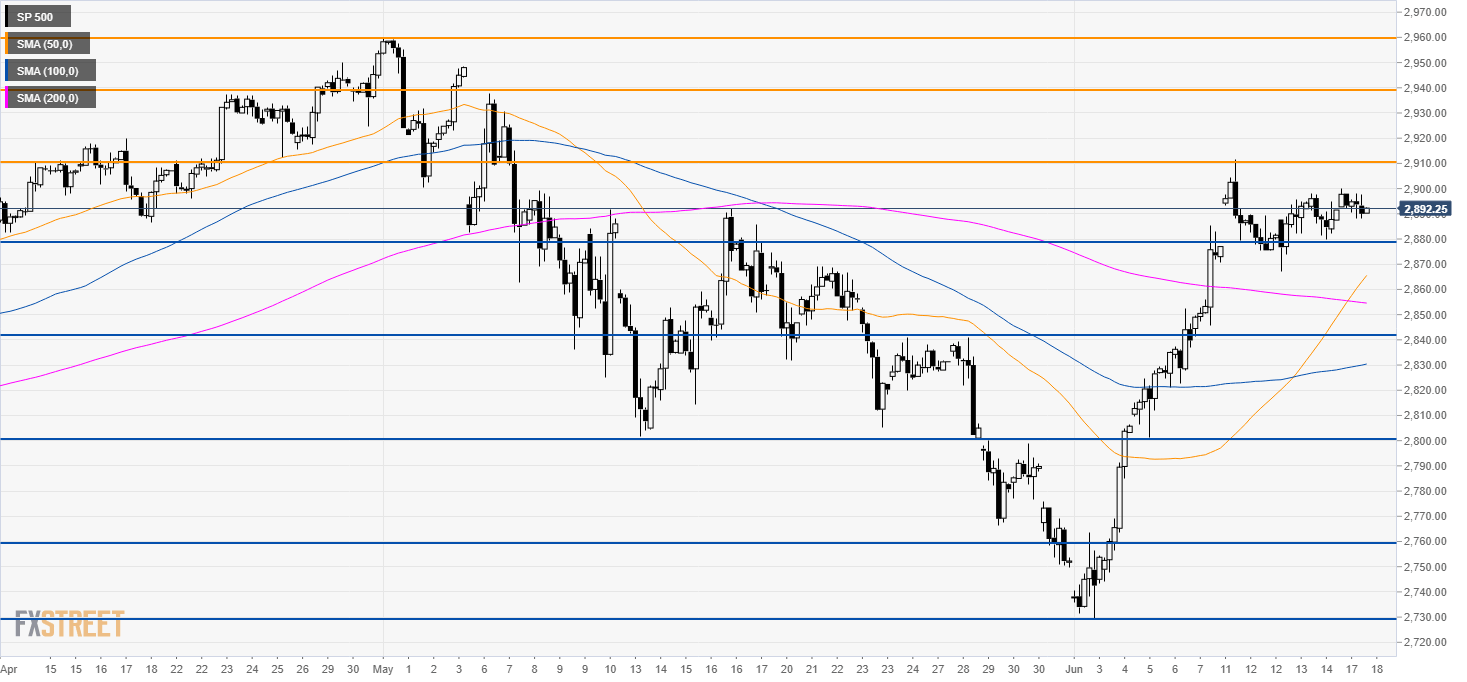
Additional key levels