10 Jun 2019
USD/JPY technical analysis: 108.70 become the level to beat for bulls
- USD/JPY have found support at the 108.00 handle.
- USD/JPY will need to overcome 108.70 to travel towards 109.20 resistance.
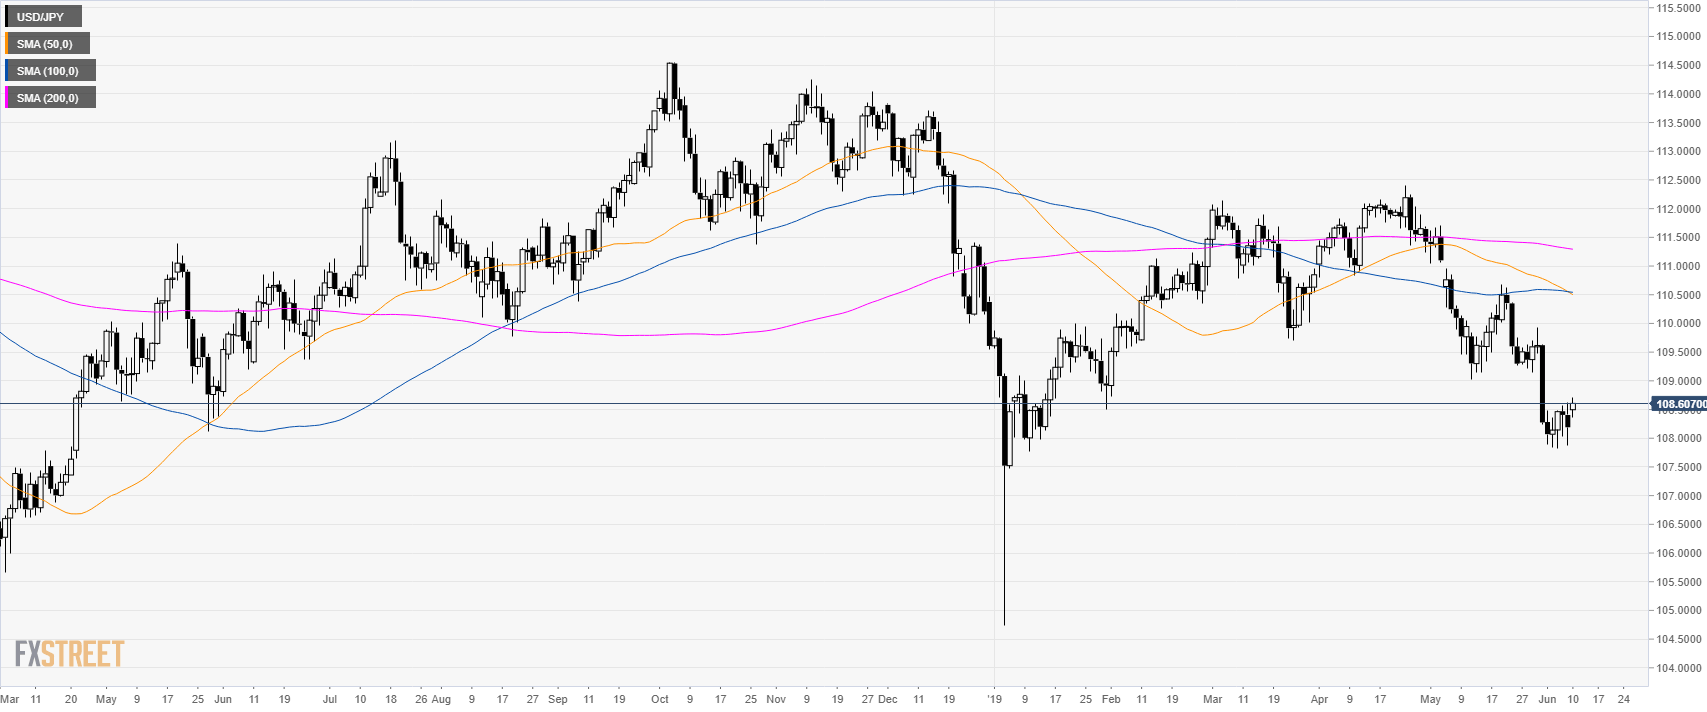
USD/JPY daily chart
USD/JPY is in a bear leg below the main daily simple moving averages (DSMAs).
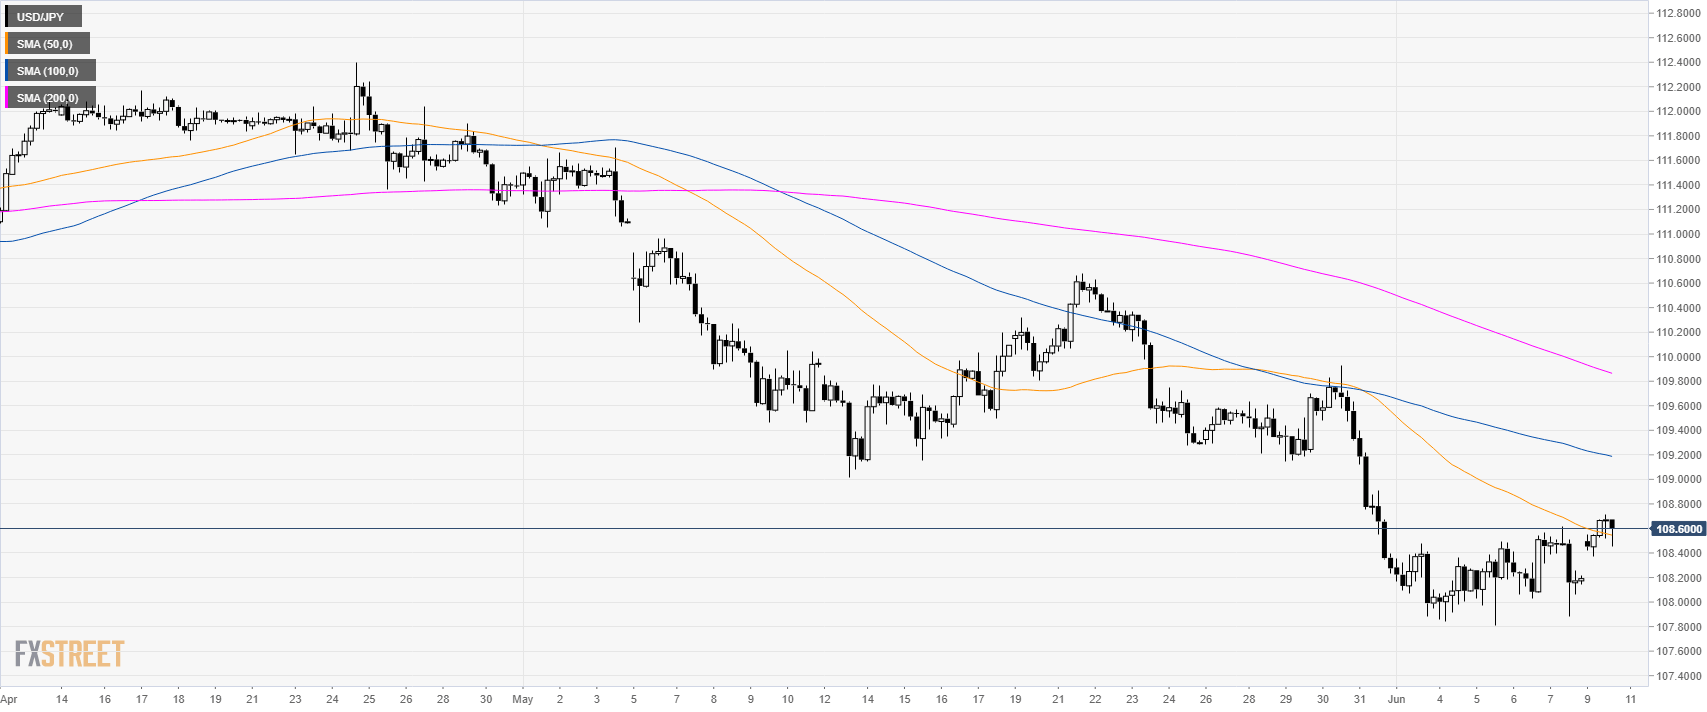
USD/JPY 4-hour chart
USD/JPY is consolidating the losses above the 108.00 handle and the 50 SMA.
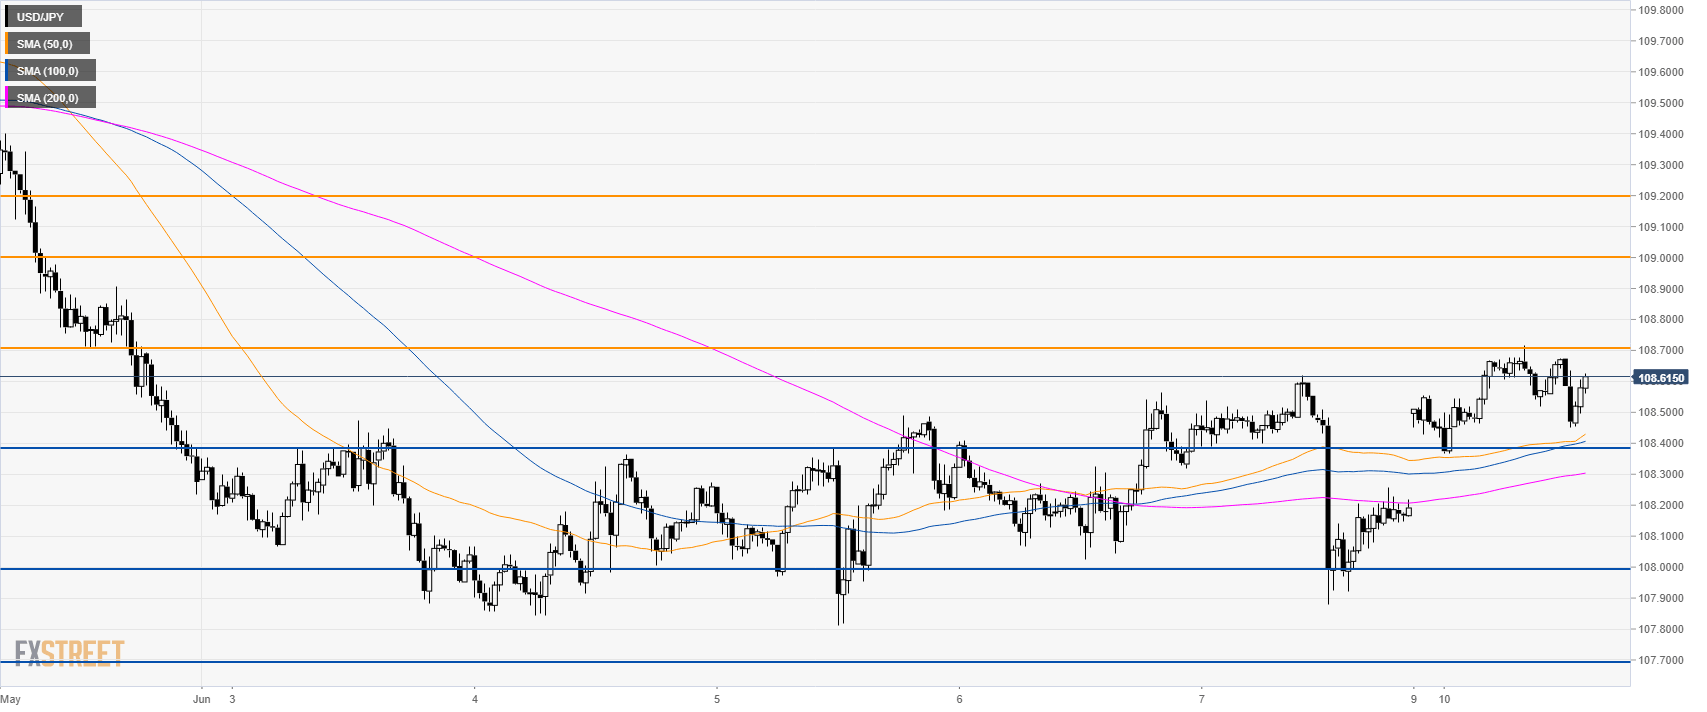
USD/JPY 30-minute chart
Buyers have found some support above the 108.00 figure. A break above 108.70 can lead to more gains towards 109.00 and 109.20 to the upside. Support is seen at 108.40 and 108.00.
Additional key levels