26 Mar 2019
AUD/USD Technical Analysis: Aussie bulls challenging the 0.7150 resistance
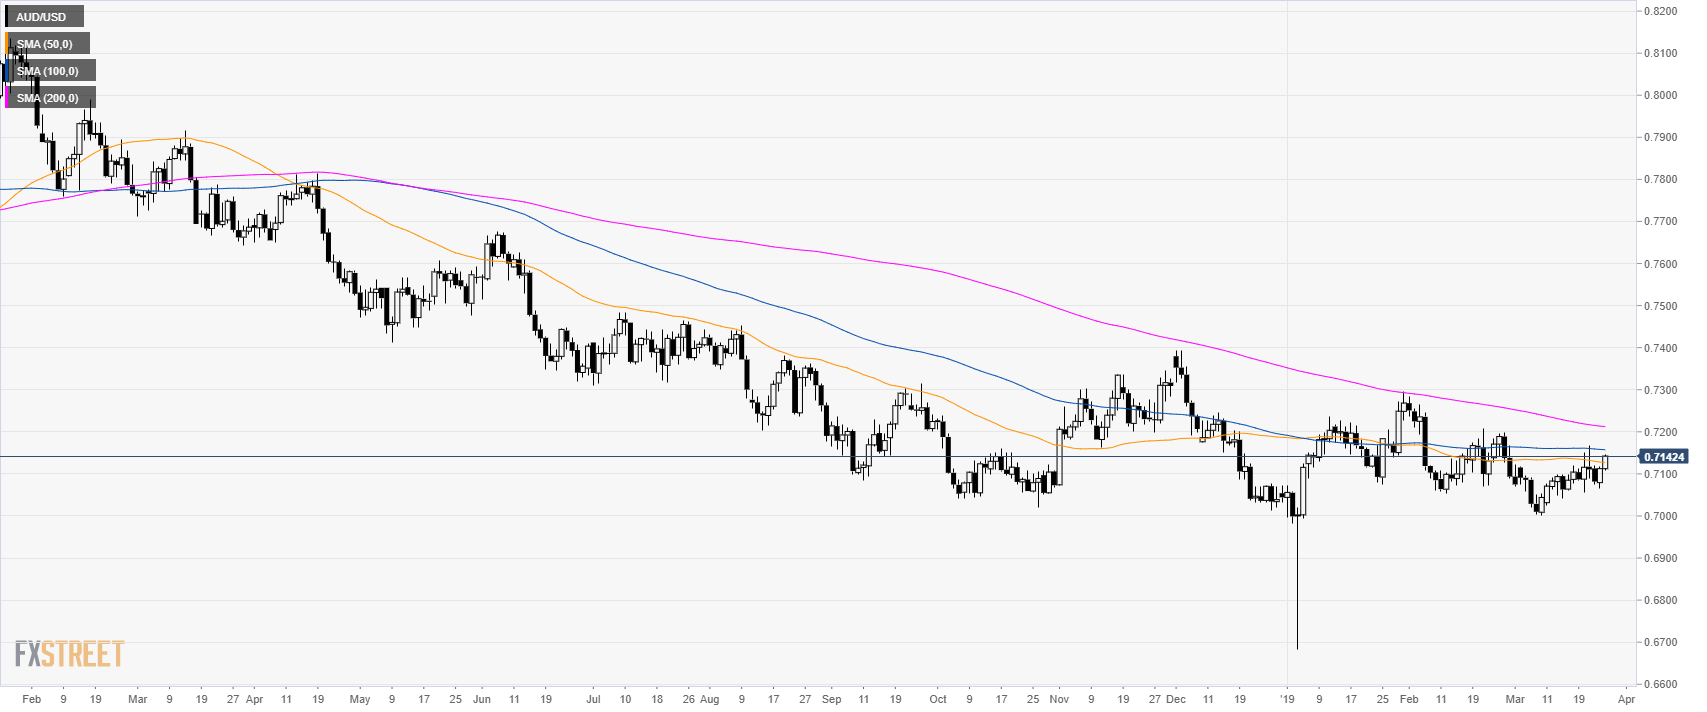
AUD/USD daily chart
- AUD/USD is trading in a bear trend below its main simple moving averages (SMAs).
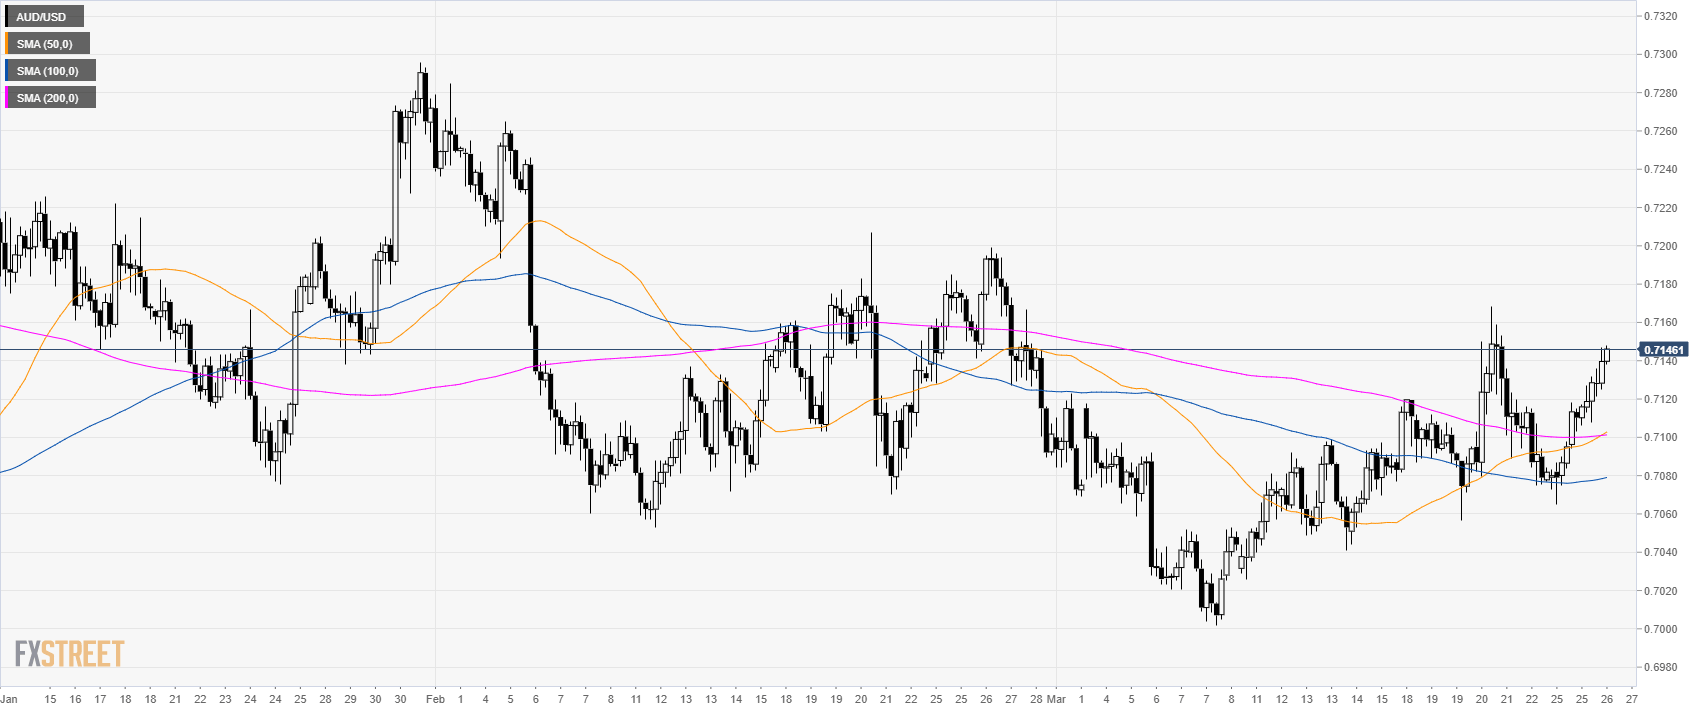
AUD/USD 4-hour chart
- AUD/USD is trading above its main SMAs suggesting a bullish bias in the medium-term.
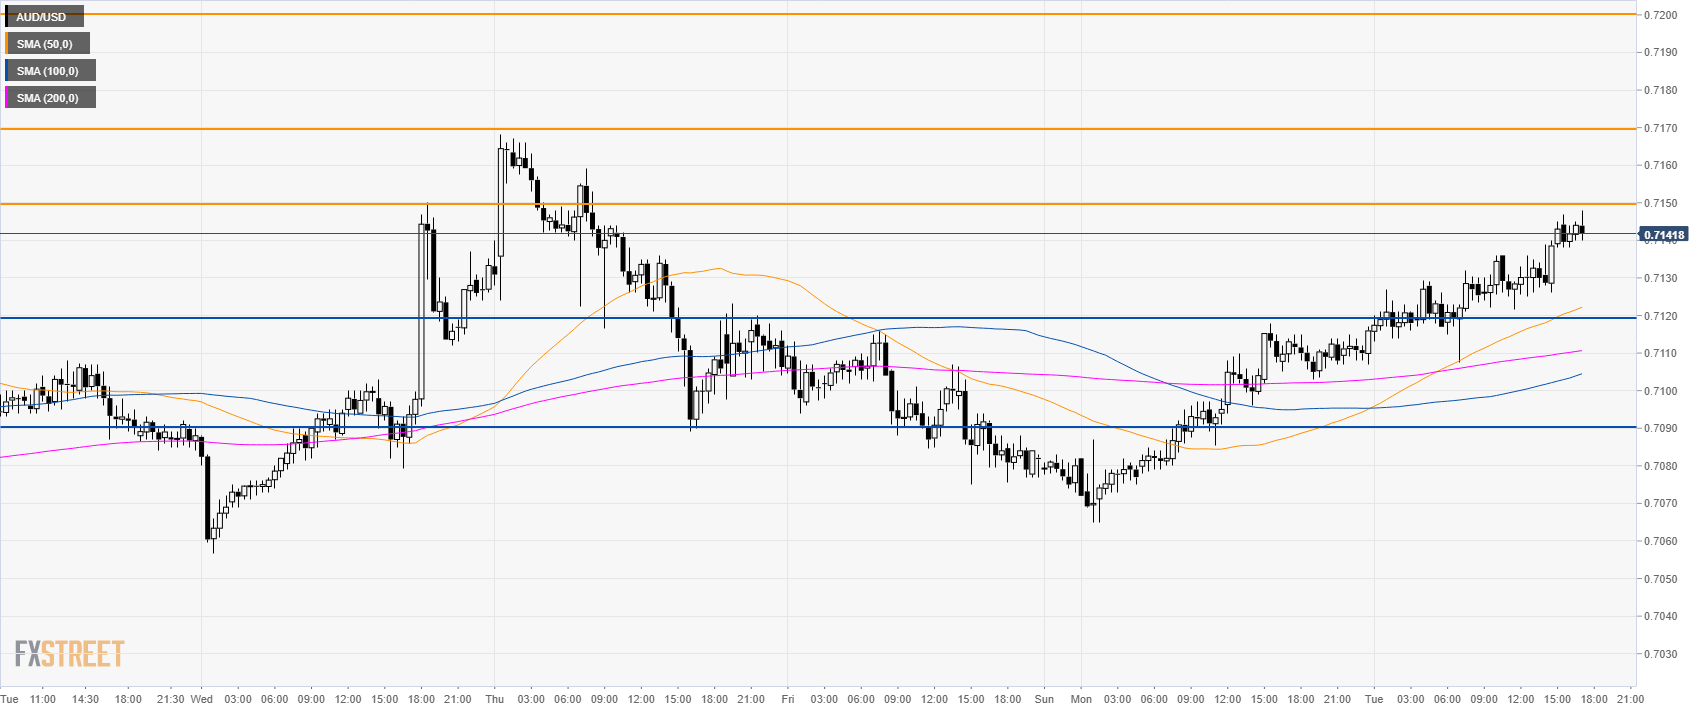
AUD/USD 30-minute chart
- AUD/USD is trading above its main SMAs suggesting a bullish bias in the short-term.
- A bullish break above 0.7150 can lead to 0.7170 and 0.7200 resistances.
- To the downside, support is at the 0.7120 and 0.7090 level.
Additional key levels