S&P500 Technical Analysis: 2,650.00 bear target achieved and exceeded as sellers sink the market to the 2,620.00
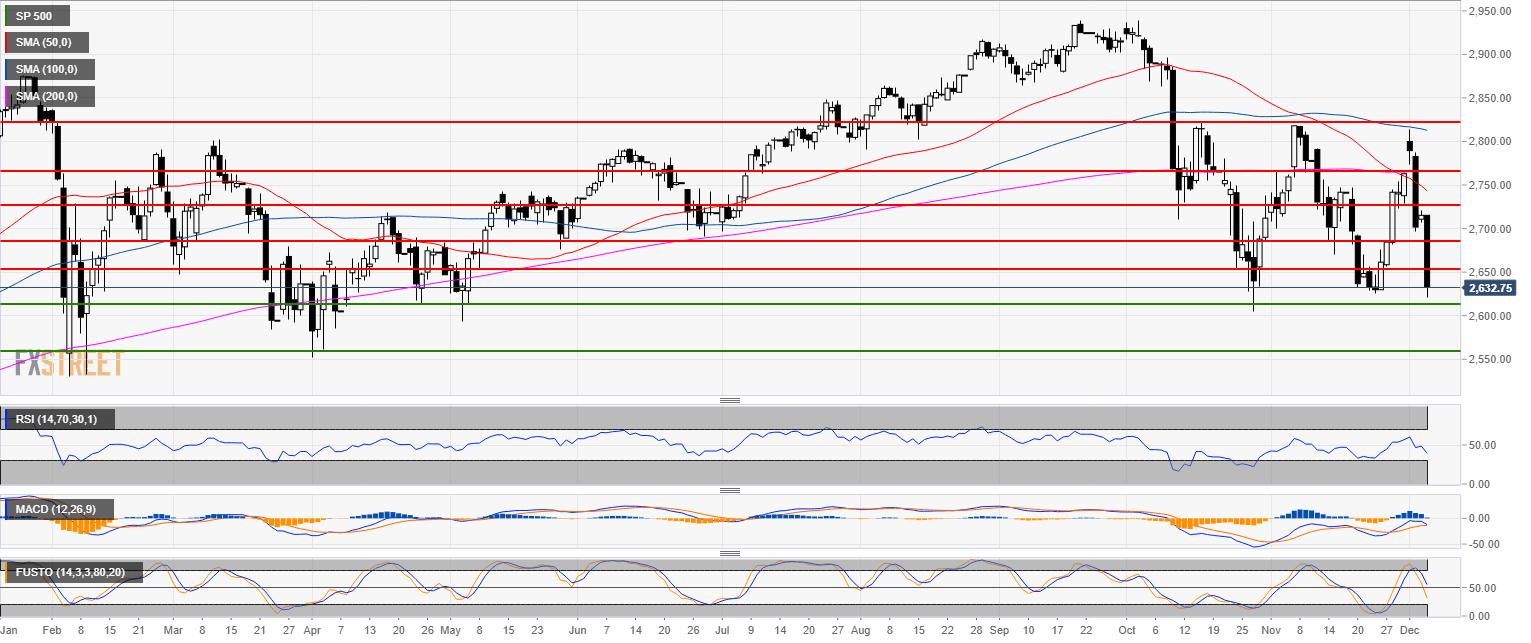
S&P500 daily chart
- USD/JPY is in a bear trend below the 200-day simple moving average (SMA).
- As forecast, the S&P500 hit the 2650.00 bear target.
- The S&P500 is now trading at daily lows just above the 2,600.00 figure. The market should hold in the short-term and 2,686.00 should be the next bull target. Alternatively, a break below 2,600.00 would open the doors to further losses.
Additional key levels
SP 500
Overview:
Today Last Price: 2624
Today Daily change: -9.1e+3 pips
Today Daily change %: -3.36%
Today Daily Open: 2715.25
Trends:
Previous Daily SMA20: 2710.01
Previous Daily SMA50: 2749.08
Previous Daily SMA100: 2814.58
Previous Daily SMA200: 2765.7
Levels:
Previous Daily High: 2721
Previous Daily Low: 2707.5
Previous Weekly High: 2764
Previous Weekly Low: 2629.8
Previous Monthly High: 2818.75
Previous Monthly Low: 2626
Previous Daily Fibonacci 38.2%: 2715.84
Previous Daily Fibonacci 61.8%: 2712.66
Previous Daily Pivot Point S1: 2708.17
Previous Daily Pivot Point S2: 2701.08
Previous Daily Pivot Point S3: 2694.67
Previous Daily Pivot Point R1: 2721.67
Previous Daily Pivot Point R2: 2728.08
Previous Daily Pivot Point R3: 2735.17