USD/CAD soars above the 20-day SMA after hawkish FOMC minutes
- The USD/CAD jumped above the 20-day SMA for the first time since early June to 1.3285.
- Rising yields following hawkish FOMC minutes benefitted the USD.
- Rising Oil prices to limit falling CAD losses.
Following the release of hawkish FOMC minutes, the USD/CAD pair surged above the 20-day simple moving average (SMA), reaching 1.3285. The increase in yields, driven by members of the Committee supporting a 25 bps hike in the June meeting, favoured the US Dollar, contributing to the pair's upward momentum. However, the West Texas Intermediate Crude Oil (WTI) is seeing more than 1% gains on the day and limits the CAD’s downside potential.
Based on the minutes of the FOMC meeting in June, it was revealed that while some members of the Committee supported a 25 basis point increase despite agreeing to pause the hike temporarily. These members were concerned that tightening the labour market could lead to inflationary pressures. Therefore, they decided to pause and assess the impact of monetary policy on the US economy before making any further decisions. The Committee also reached a consensus to maintain rates in a restrictive stance.
Following this development, there was a general increase in US yields. Specifically, the 2-year yield rose to 4.95%, a 0.78% increase, while the rates for the 5-year and 10-year bonds reached 4.24% and 3.93%, rising by 1.81% and 1.90%, respectively.
Regarding the next Federal Reserve (Fed) meeting in July, markets anticipate a 25 basis points hike. However, investors await crucial labour market data for the US from June on Thursday. The employment figures, to be released by the ADP Research Institute on Thursday, are expected to be around 228k, indicating a deceleration from the previous figure of 278k. Additionally, the US Department of Labor Jobless Claims is projected to rise to 245k on a weekly basis.
USD/CAD levels to watch
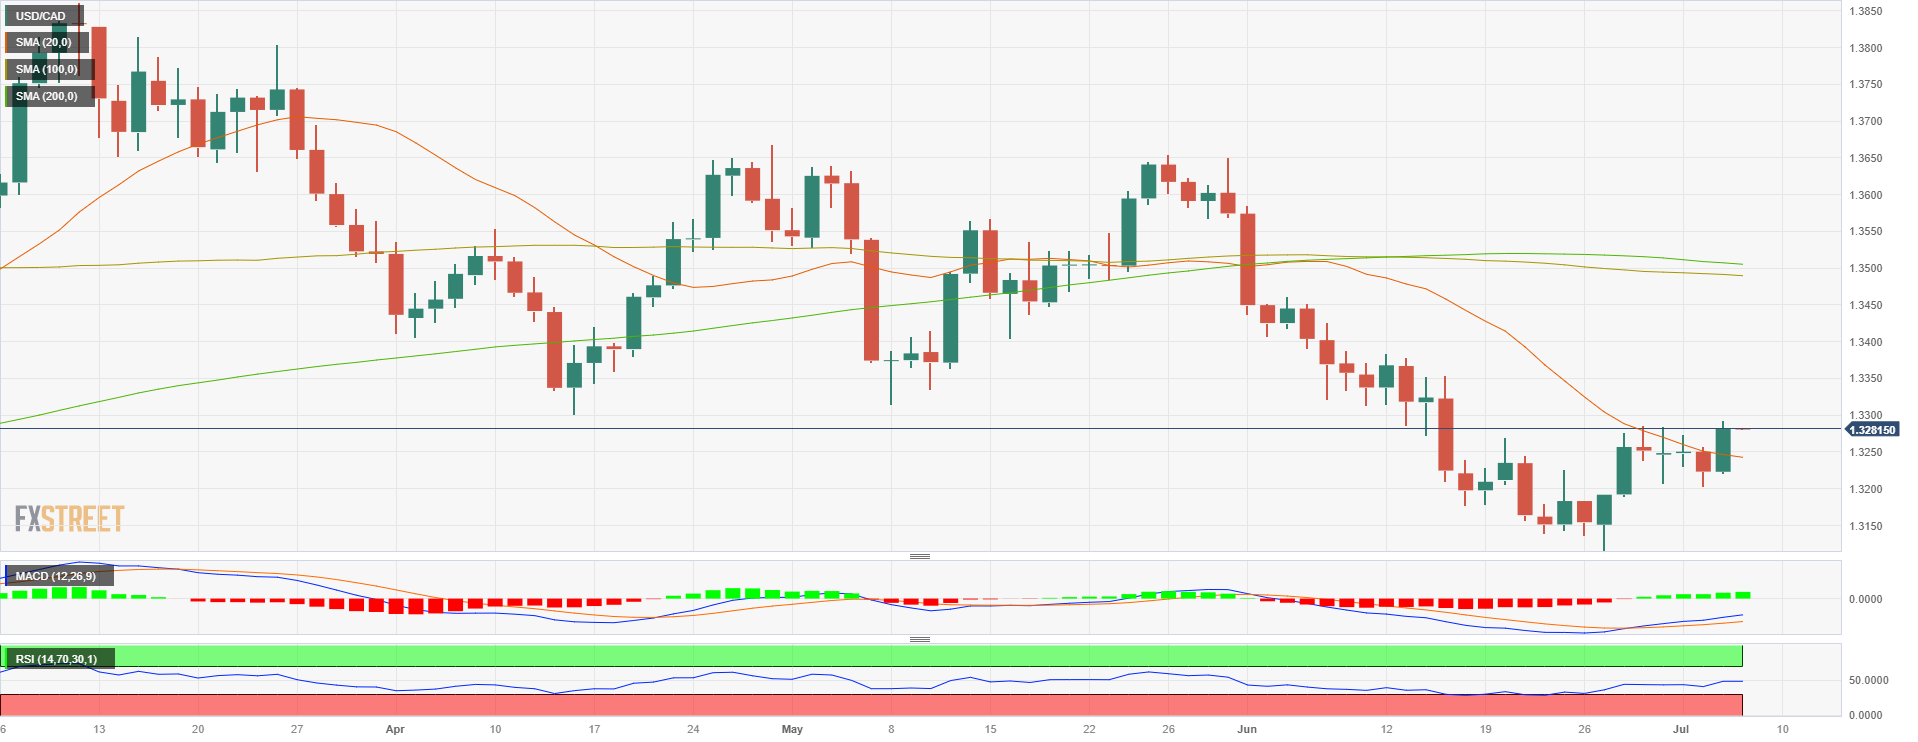
On the daily chart, the USD/CAD appears neutral to bullish in the short term. Despite standing in negative territory, the Relative Strength Index (RSI) and the Moving Average Convergence Divergence (MACD) are gaining momentum, suggesting that the buyers are gearing up for another upwards leg.
Support Levels to watch: 1.2345 (20-day Simple Moving Average), 1.2320, 1.3190.
Resistance Levels to watch: 1.3300, 1.3320, 1.3350.
USD/CAD Daily chart